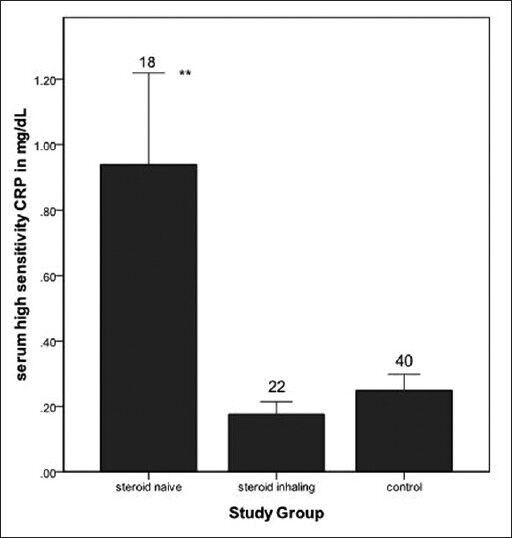
Figure 1.

Bar chart representing mean value of serum high sensitivity C-reactive protein (hs-CRP) levels among three study groups. Error bars show standard error of the mean and number over error bar indicates sample size of the respective groups. Steroid naïve asthmatics had higher mean hs-CRP compared to healthy control (**P < 0.01)
