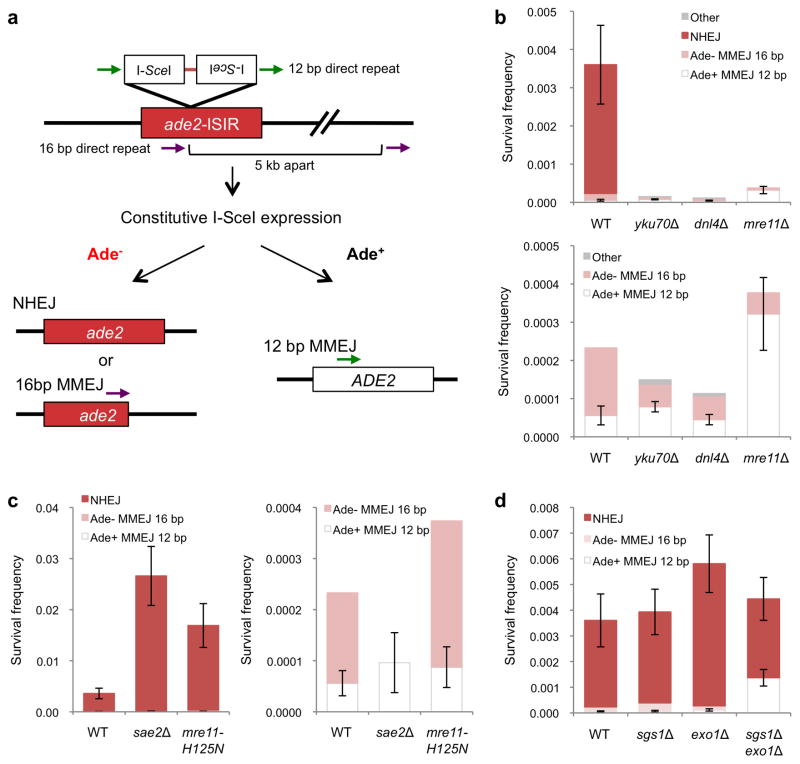
Figure 1. Role of resection initiation and extensive resection in end-joining repair.
a, Schematic representation of the chromosomal end-joining assay. Most of the Ade+ survivors use the 12 bp direct repeats flanking the DSB to restore the ADE2 coding region. Ade− end joining products result from NHEJ, or from MMEJ between naturally occurring imperfect 16 bp repeats located 5 kb apart. b, Graphs showing survival frequencies (CFU galactose/CFU glucose) of the indicated strains. The upper panel shows all classes of events and the lower panel shows the distribution of MMEJ events. c, Graphs showing survival frequencies (left) and distribution of MMEJ products (right) in resection-initiation defective mutants. d, Graph showing survival frequency and distribution of end joined products for the exo1Δ and sgs1Δ mutants. Mean values are shown and error bars represent standard deviation (s.d.) from the mean, significance was determined by a 2-tailed Student’s t test. The number of trials for each strain is presented in Table 1. WT refers to wild type, other refers to Ade− MMEJ events which used MH other than the 16 bp interrupted MH (Supplementary Table 2).

