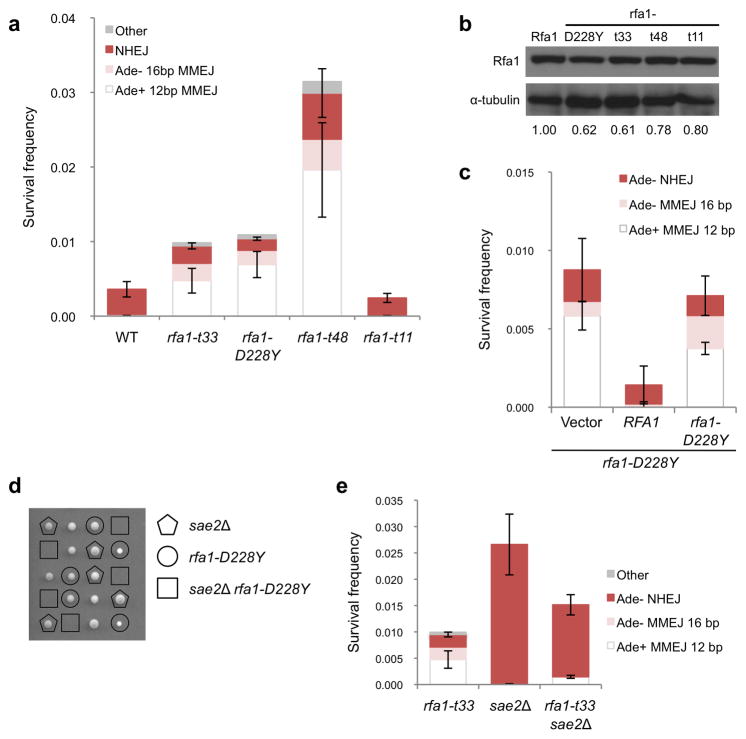
Figure 2. Annealing between MH is prevented by RPA.
a, Graph showing survival frequencies and distribution of end joining events in rfa1 hypomorphic mutants. All NHEJ events detected in the rfa1-D228Y, rfa1-t33 and rfa1-t48 mutants were Ade−. b, Western blot of steady-state protein levels of the indicated rfa1 mutants. c, Graph showing survival frequencies and distribution of end joining events in strains over-expressing RFA1 or rfa1-D228Y in the rfa1-D228Y background. d, Viability and genotype of haploid spores derived from diploids heterozygous for sae2Δ and rfa1-D228Y. The genotype of dead spores is inferred by the segregation pattern of sae2Δ and rfa1-D228Y. e, Graph showing distribution of end joined products in the sae2Δ rfa1-t33 mutant. Mean values are shown and error bars represent s.d. from the mean, significance was determined by a 2-tailed Student’s t test. The number of trials for each strain is presented in Table 1.

