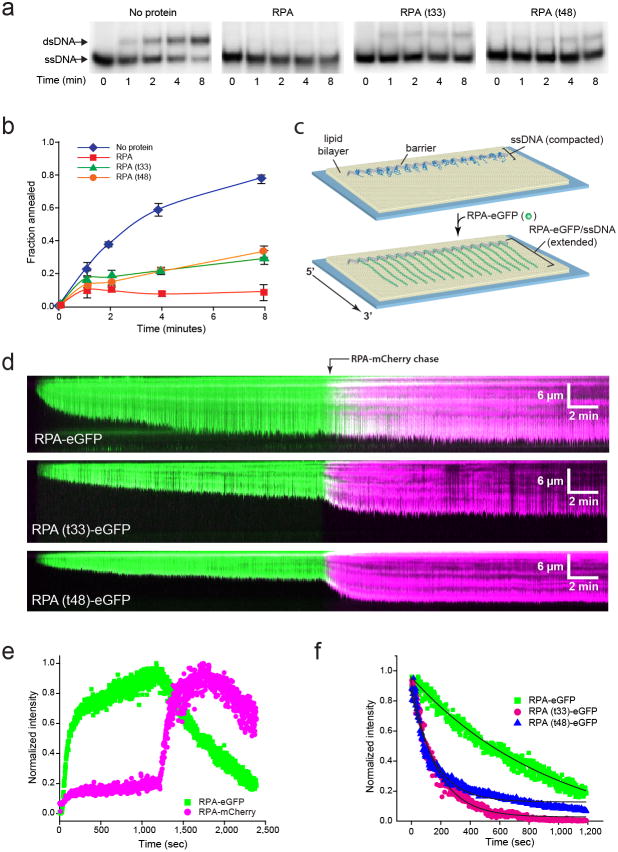
Figure 3. RPA mutants are defective for ssDNA binding and disruption of secondary structure.
a, Polyacrylamide gel electrophoresis to separate substrates (ssDNA) and products (dsDNA) of the strand annealing reaction. Each gel shows time points (0–8 min) from the annealing reaction in the absence of protein or in the presence of 30 nM RPA, RPA(t33) or RPA(t48). b, Quantification of the annealed dsDNA product. Fraction of annealing was calculated as the radioactivity in the dsDNA band divided by the sum of two bands. Values are a mean of three trials and errors bars indicate s.d. c, Schematic of an ssDNA curtain assay showing ssDNA before and after RPA-eGFP binding. d, Kymographs showing ssDNA binding by RPA-eGFP, RPA(t33)-eGFP or RPA(t48)-eGFP (100 pM each), as indicated, followed by exchange with RPA-mCherry (100 pM). e, Graph of normalized signal intensity for both RPA-eGFP and RPA-mCherry over time. f, Graph comparing the dissociation kinetics of RPA-eGFP, RPA(t33)-eGFP as RPA(t48)-eGFP following the injection of RPA-mCherry (not shown). The solid black lines are single exponential fits approximating the dissociation of the eGFP-tagged RPA’s during exchange with RPA-mCherry, yielding rates of ~0.006 sec−1 for both RPA mutants and ~0.001 sec−1 for RPA-eGFP.

