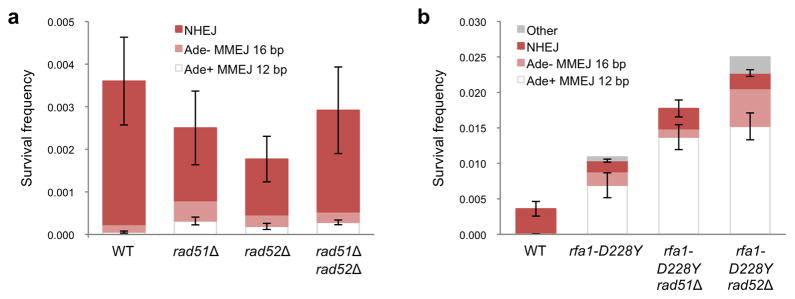
Figure 4. HR and MMEJ are competing mechanisms.

a, Graph showing survival frequency and distribution of end joining products for rad51Δ, rad52Δ and rad51Δ rad52Δ mutants. b, Frequencies of NHEJ and MMEJ in rfa1-D228Y derivatives. Mean values are shown and error bars represent s.d. from the mean, significance was determined by a 2-tailed Student’s t test. The number of trials for each strain is presented in Table 1.
