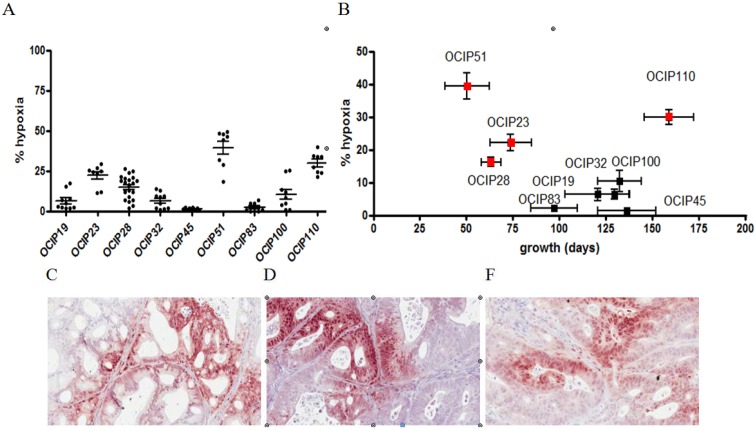
Figure 1.
Patient-derived pancreatic xenograft models differ in the magnitude of tumor hypoxia and metastatic potential. (A) Percentage of tumor hypoxia as indicated by EF5 staining of the patient-derived xenograft models. Each point represents the hypoxia status in a single tumor. The xenograft models display a wide range of tumor hypoxia that remains similar over several passages in vivo; (B) EF5 staining vs. tumour growth shows that hypoxia mostly correlates with rapid growth pattern. Tumor growth is defined by the time elapsed between two passages. Metastatic models are labelled in red. Representative sections of (C) OCIP19, (D) OCIP23 and (E) OCIP51 stained for EF5. Tumor hypoxia in all models is found in both the tumor and tumor-associated stroma.

