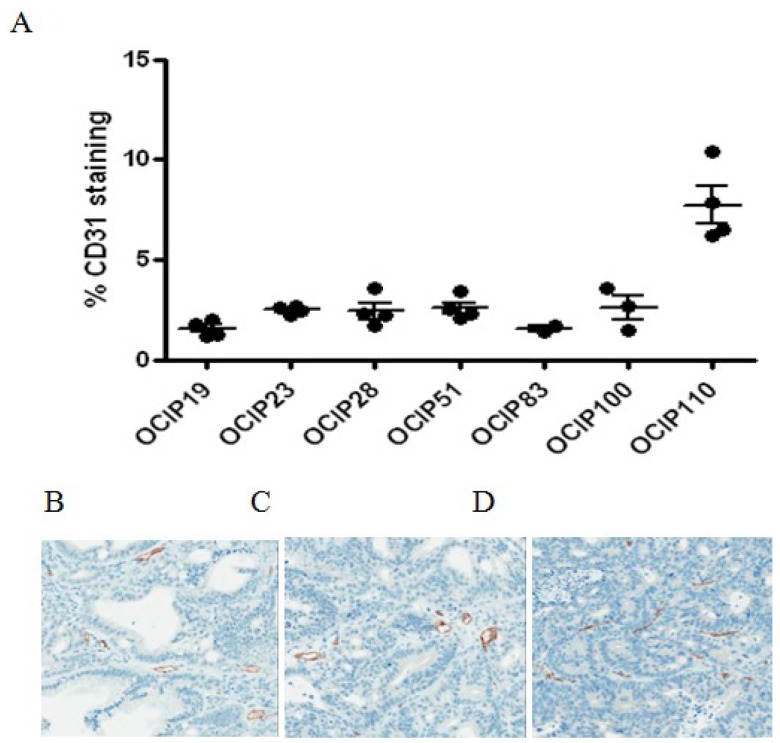
Figure 3.
Patient-derived pancreatic xenograft models differ in microvessel density. (A) Percentage of CD31 of the patient-derived xenograft models. Each point represents a single tumor. In these models, staining for CD31 indicating vessel density shows little difference between the tested models and shows no correlation with tumor hypoxia. Representative sections of (B) OCIP19, (C) OCIP23 and (D) OCIP51 stained for CD31.

