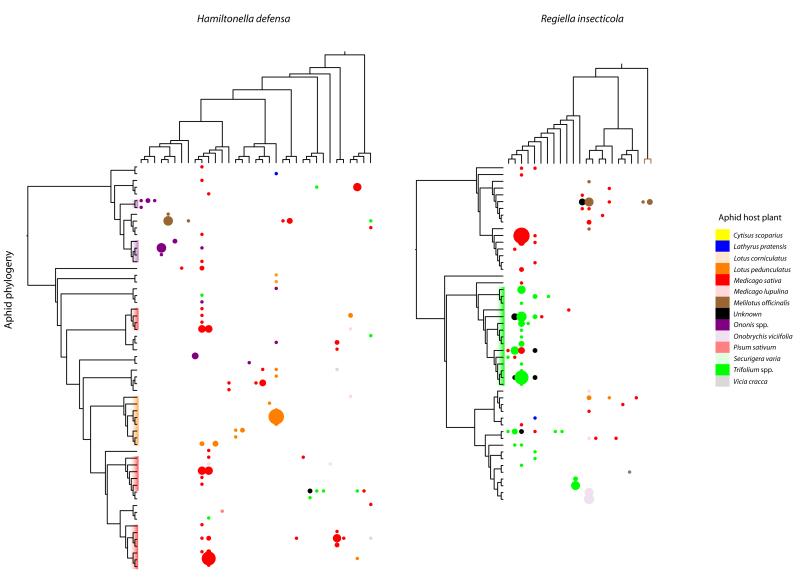
Figure 2. Interaction Matrices for Aphid, y Axis, and Symbiont Genotypes, x Axis.
Bubble size corresponds to the incidence of the genotype associations, and the color indicates the host-plant cluster of the aphid harboring the symbiont. Major aphid clades associated with Ononis spp. (purple), M. sativa (red), L. pedunculatus (orange), and Trifolium spp. (green) are highlighted on the aphid phylogeny. Aphid phylogeny is pruned to only include aphids infected by each symbiont species. See also Figure S1 for interaction matrixes on the full aphid phylogeny.

