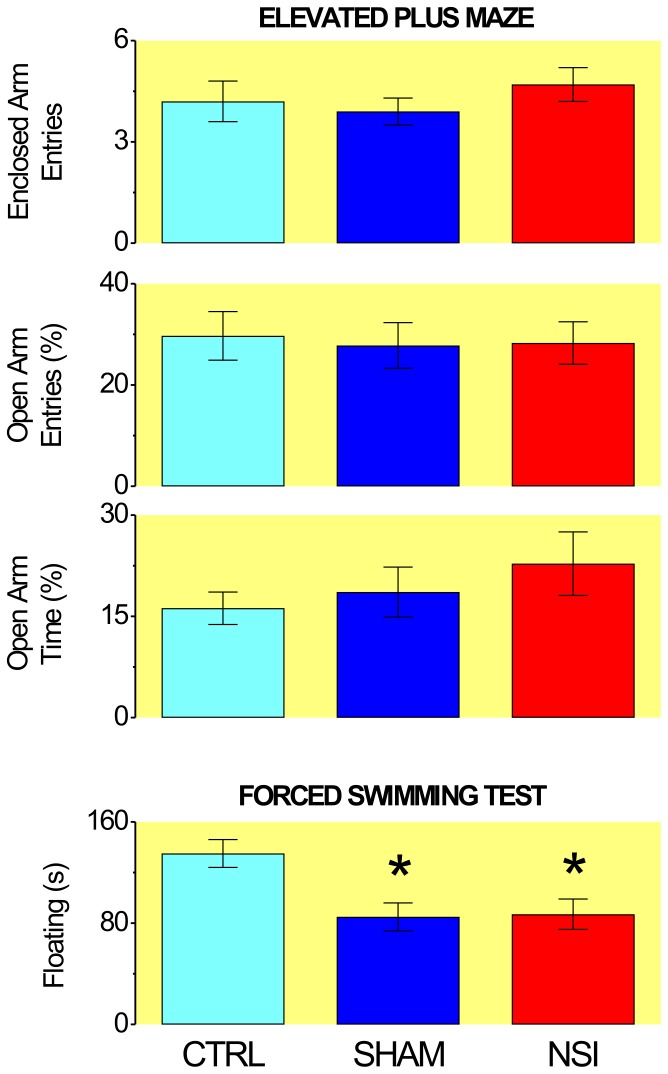
Figure 4. Effects of neonatal social isolation on the performance of adult rats in the elevated plus-maze (n = 19–27) and forced swimming test (n = 18–24).
Columns represent mean±SEM. CTRL – controls, SHAM – sham-isolated rats, NSI – neonatally-isolated rats. EAE – number of entries in enclosed arms (mean±SEM), OAE% - percent of entries in open arms, OAT% - percent of time in open arms. * P<0.005, statistically different from CTRL.

