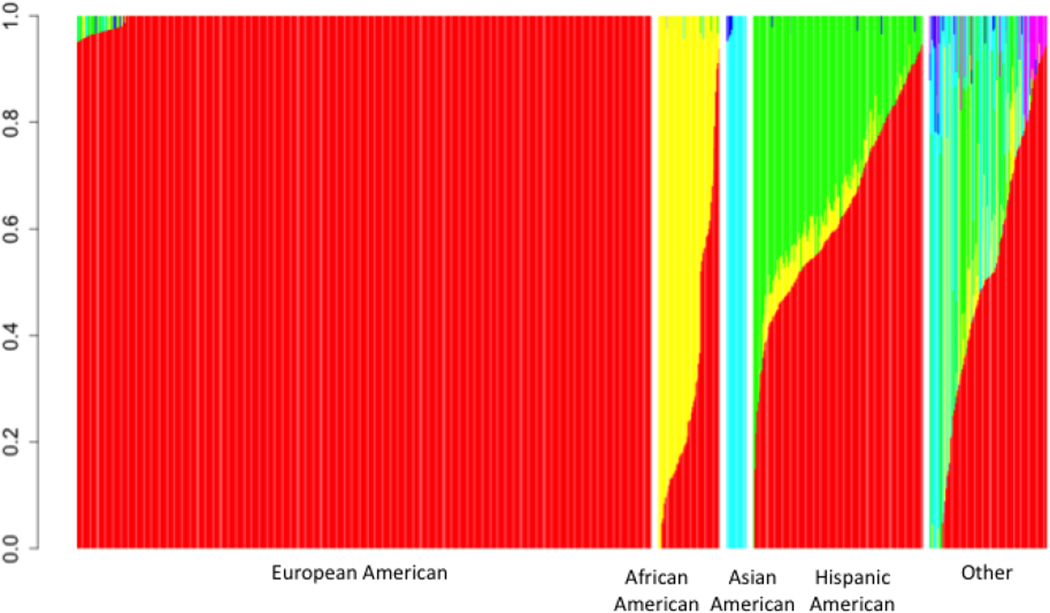
Figure 1.
Admixture proportion of individuals included in the study. Each individual is represented by a vertical bar divided into colored segments. The size of each colored segment reflects the proportion of admixture from one of six major continental populations (red – European; Yellow – African; green – Native American; turquoise – East Asian; blue – Oceanic; magenta – Central Asian). Individuals in each ancestral category are sorted by the degree of European admixture (i.e., size of red segments).

