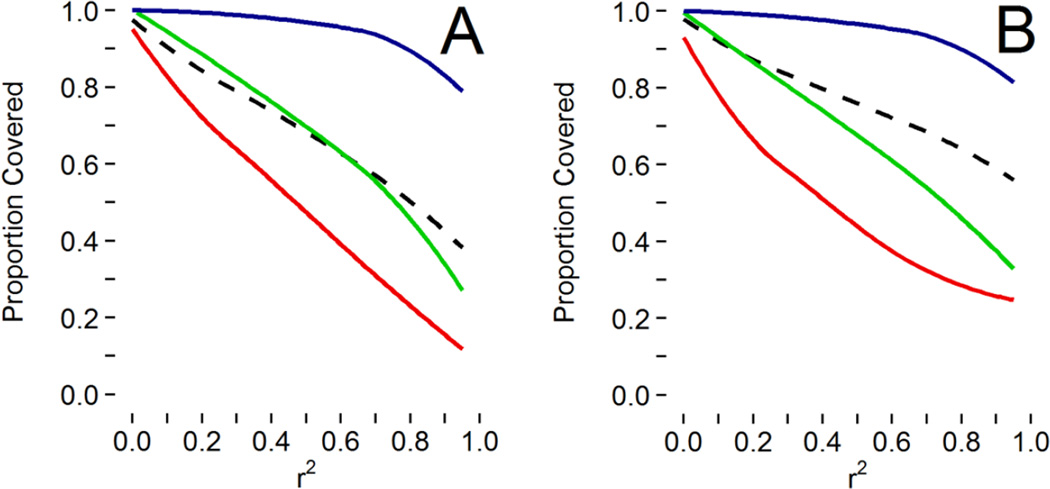
Figure 2.
The proportion of imputable markers (N=80,205) exclusive to the HOEE (i.e. HE content) covered by imputation, based on the HOE and 1000 Genomes reference haplotypes across: a) all subjects (N=2,548); b) European Americans (N=1,476). Marker frequencies: blue – common (MAF>0.05); green – moderately common (0.01≤MAF≤0.05); red – rare (MAF<0.01); and black dashed – all.

