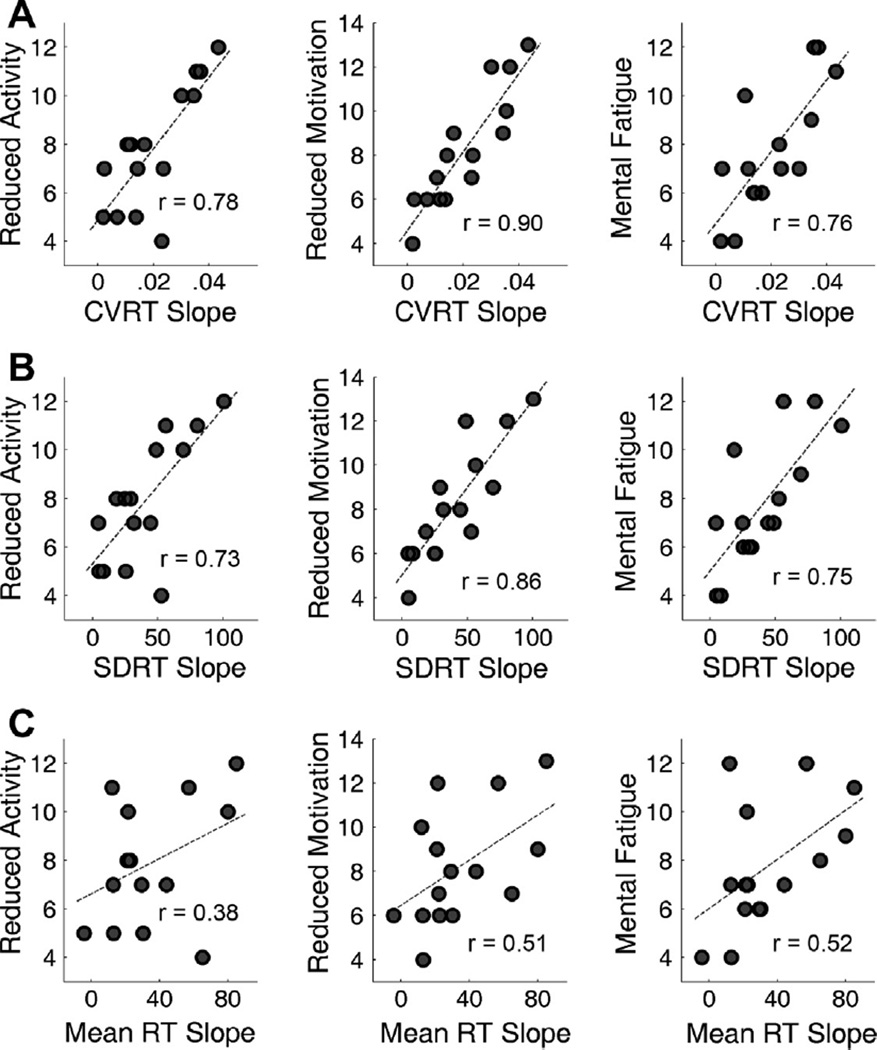
Fig. 4.
Scatter plots displaying the correlation between cognitive fatigability, measured as the slope of performance versus time block regression line, and the subjective fatigue scales (MFI-20 subscales). Each dot represents one of the 15 participants. (A) Correlations between CVRT slope and the subjective fatigue scales. CVRT slope significantly correlated with the reduced activity scale (r = 0.78, p < 0.001), the reduced motivation scale (r = 0.90, p < 0.001) and the mental fatigue scale (r = 0.76, p < 0.001). (B) Correlations between SDRT slope and the subjective fatigue scales. Similar to CVRT slope, SDRT slope significantly correlated with the reduced activity scale (r = 0.73, p = 0.002), the reduced motivation scale (r = 0.86, p < 0.001) and the mental fatigue scale (r = 0.75, p = 0.001). (C) Correlations between mean RT slope and the subjective fatigue scales. Significant correlations were found for the reduced motivation scale (r = 0.51, p = 0.050) and the mental fatigue scale (r = 0.52, p = 0.048), but not for the reduced activity scales (r = 0.38, p = 0.160).

