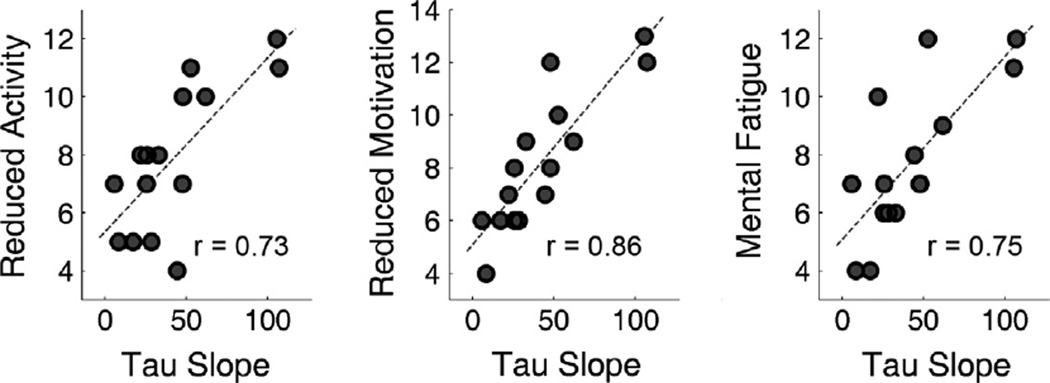
Fig. 6.
Scatter plots displaying the correlation between the slope of parameter τ versus time block regression line and the subjective fatigue scales. Similar to SDRT slope and CVRT slope, τ slope significantly correlated with the reduced activity scale (r = 0.73, p = 0.002), the reduced motivation scale (r = 0.86, p < 0.001) and the mental fatigue scale (r = 0.75, p = 0.001).

