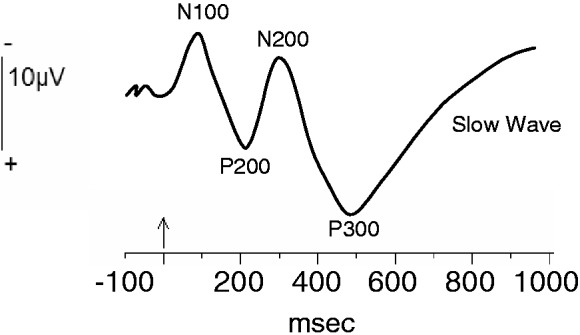
Fig. 1.

A schematic representation of an ERP waveform elicited by a novel visual stimulus. The vertical arrow on the timeline (horizontal axis) represents stimulus onset time. The positive and negative deflections in the waveform represent typical ERP components, named here according to their polarity (‘P’ for positive deflections and ‘N’ for negative deflections) and the approximate post-stimulus time (in milliseconds) of their peaks. Note, however, that this temporal naming convention is based on broad generalities such that the specific time varies considerably between different experimental tasks. Another method for component naming involves assigning numbers to the positive and negative deflections as a function of their ordinal position following stimulus onset (e.g. N1, P1, N2, etc.). Note, also, that negative voltages are plotted above zero on the Y-axis, following electrophysiological convention, although ERP waveforms are sometimes plotted with negative voltages displayed below zero.
