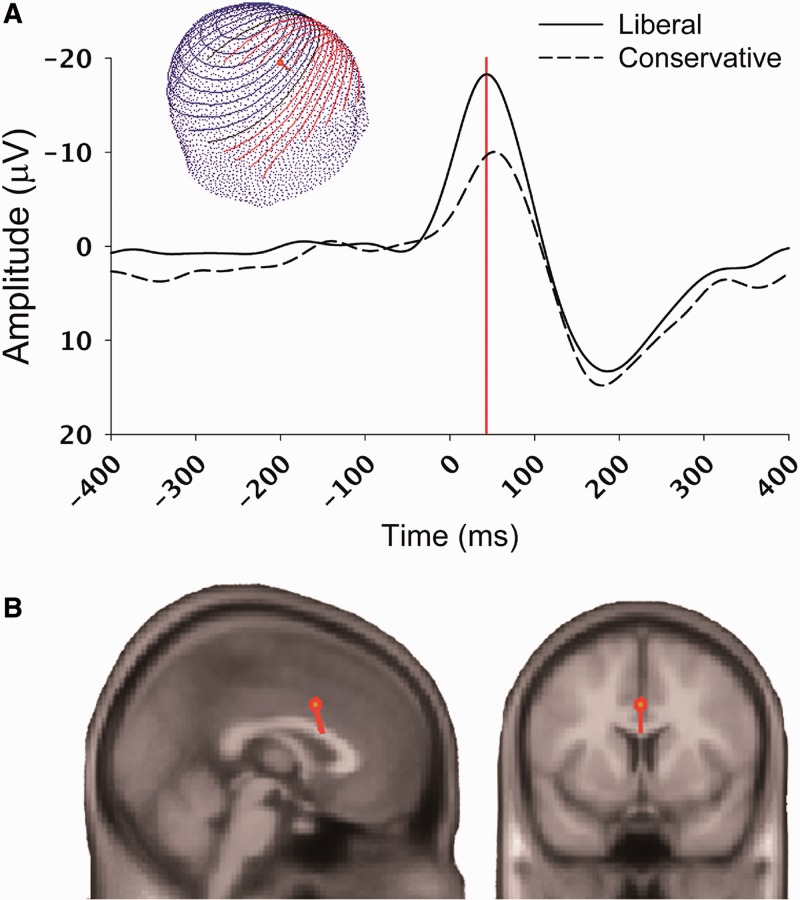
Fig. 3.
Illustration of the ERN component, as observed in a study on the relation between political orientation and individual differences in conflict monitoring processes (Amodio et al., 2007). Panel A depicts the ERN component in response to errors on No-Go trials of a Go/No-Go task for both liberal and conservative participants, showing greater responsiveness of the conflict monitoring process among liberals (response made at 0 ms; ERN peaked at 44 ms post-response). The inset shows the voltage map of the scalp distribution of the ERN. Panel B shows source localization maps, indicating a dorsal anterior cingulate generator for the ERN, computed at peak amplitude (red line in panel A).

