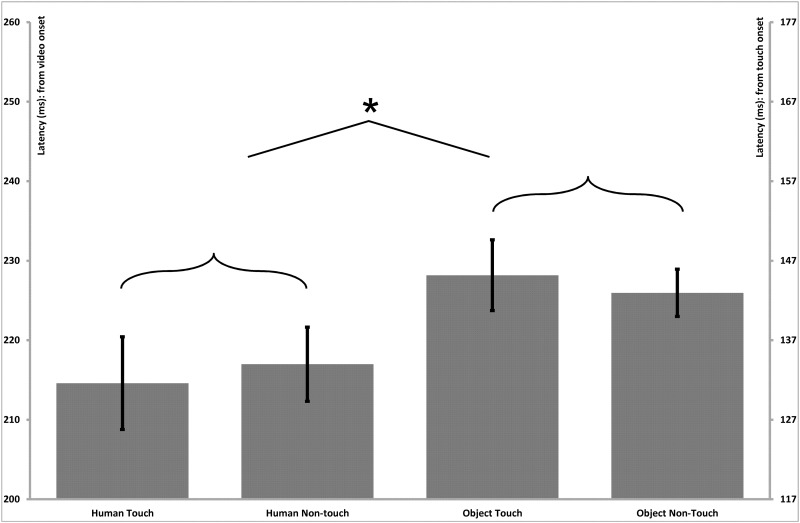
Fig. 6.
Parietal–central (somatosensory) N250 latency effects. Bar graphs present the mean (standard error) ERP latency differences for the N250 component in the parietal–central somatosensory region. The left vertical axis presents timing in relation to the initial onset of the video stimulus, and the right vertical axis presents timing in relation to the onset of the touch within the video stimulus. The latencies exhibited a main effect of Stimulus Type, indicating shorter latencies for human vs object stimuli.

