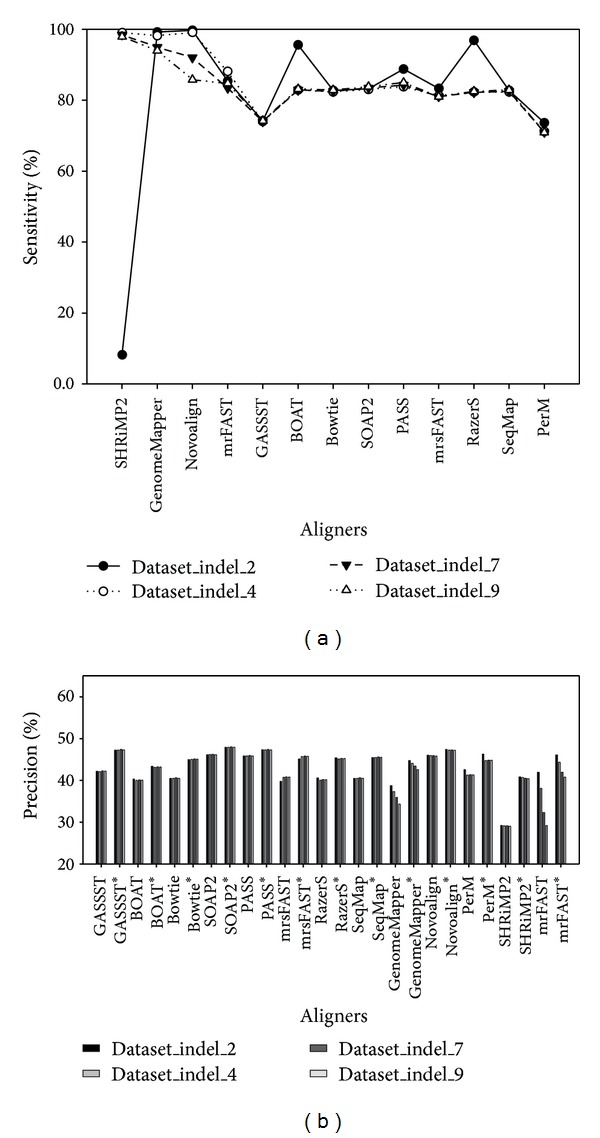
Figure 6.

Graphical representation shows alignment accuracy results using in silico short-read datasets with varying indel sizes. Based on in silico short-read datasets sampled from chromosome X of H. sapiens with varying indel sizes (e.g., 2 bp, 4 bp, 7 bp, and 9 bp, resp.), (a) shows alignment accuracy evaluation by sensitivity and (b) shows alignment accuracy evaluation by precision. Aligners with (∗) as shown in (b) are used to show alignment accuracy evaluation by precision with consideration of multimapped reads.
