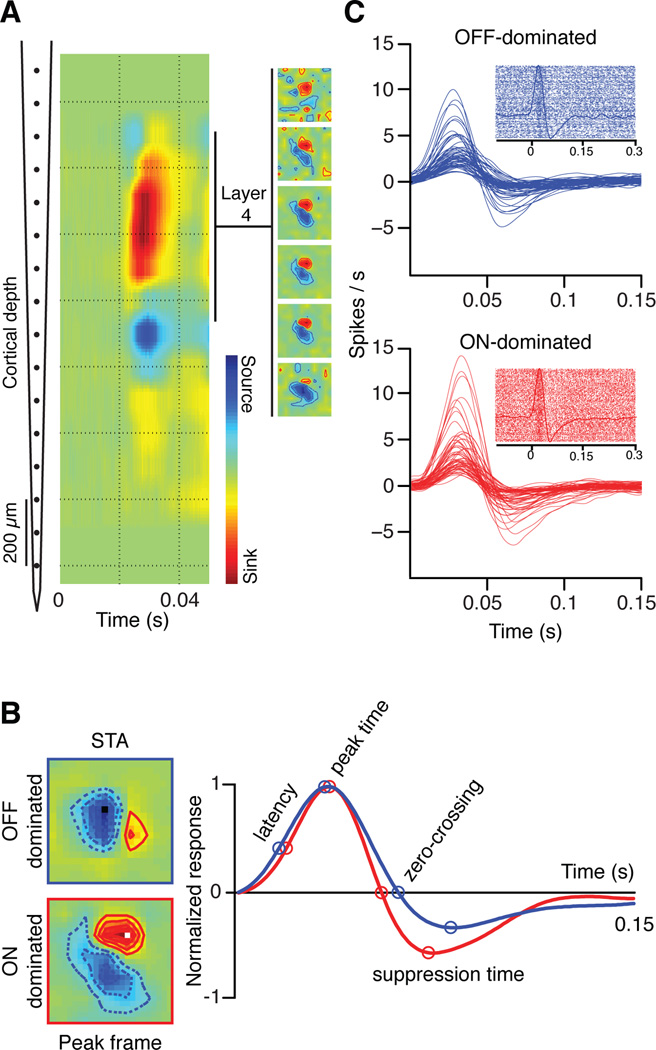
Figure 1. Recordings from cortical layer 4 in anesthetized cats.
Multiple penetrations were made using a 16-channel probe (inter-electrode distance of 100 microns) in V1 of cat visual cortex. The receptive fields were mapped using binary white noise stimuli. (a) The depth of cortical layer 4 was identified as a strong current sink generated by a full-field flash presented at time 0 (left). Cortical receptive fields were measured in layer 4 with binary white noise by spike trigger averaging the stimulus (right). (b) The white noise pixel that generated the strongest response was used to determine the dominance polarity of the cortical receptive field (light for ON-dominated, dark for OFF-dominated). Four time points (latency, peak time, zero-crossing, and suppression time) were chosen to compare the temporal dynamics. (c) The time stamps of the white noise frames with the pixel that generated the strongest response were used as triggers to generate peri-stimulus time-histograms (PSTHs) and rasters for OFF-dominated (blue) and ON-dominated cells (red). The PSTHs were calculated with a 1 ms bin and smoothed using a moving average triangular filter of 21 ms width.

