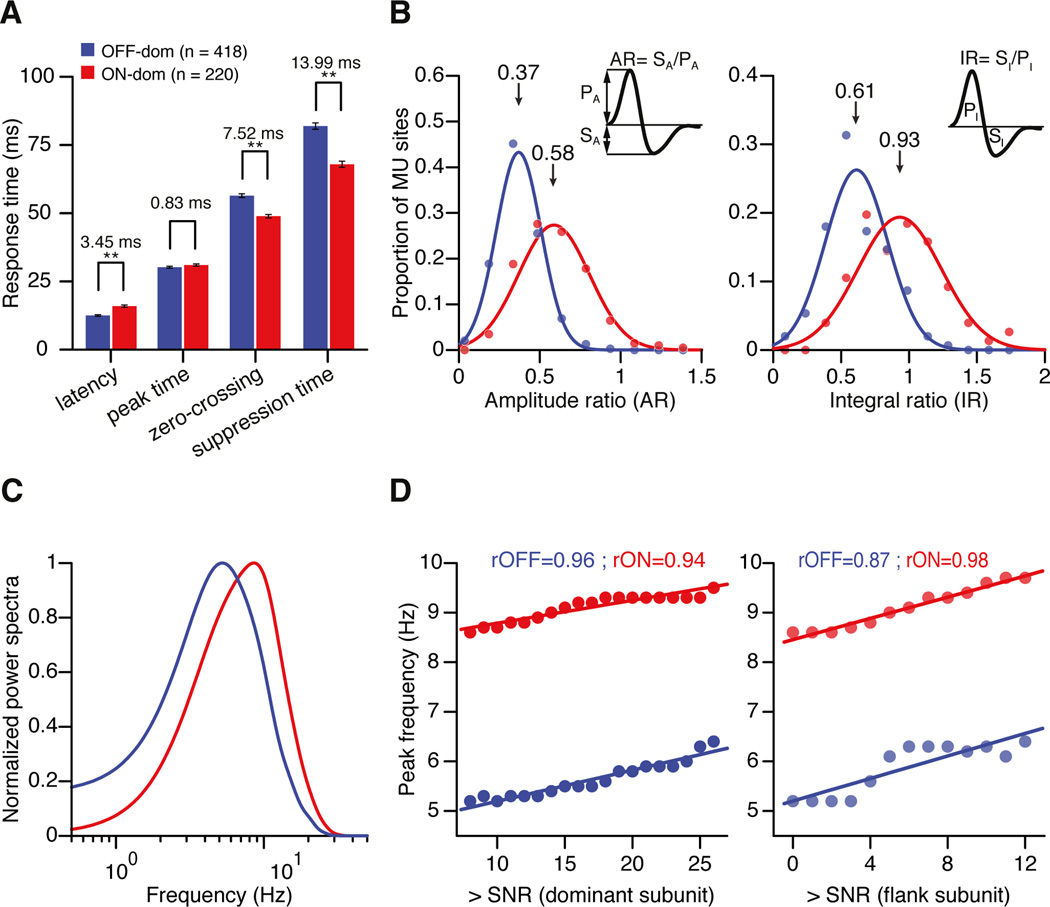
Figure 2. Response time courses of ON-dominated and OFF-dominated multiunit recording sites in cortical layer 4.
(a) Mean differences in response time course between ON-dominated (red) and OFF-dominated (blue) layer 4 recordings measured at the four time points described in Figure 1. Error bars show standard errors of mean (** indicates p < 0.001). (b) Distribution of ratios between response suppression and response increment in ON- and OFF-dominated cortical sites. The distributions were fitted with 1D Gaussian functions. Amplitude ratio (AR) was computed as the ratio of suppression amplitude to peak amplitude (SA / PA). Integral ratio (IR) (right) was computed as the ratio of the suppression integral to peak integral (SI / PI). (c) Fourier transform of the ON and OFF impulse responses represented as normalized power spectra. (d) Peak temporal frequency plotted as a function of signal-to-noise ratio of the dominant (left) and flank subregions (right).

