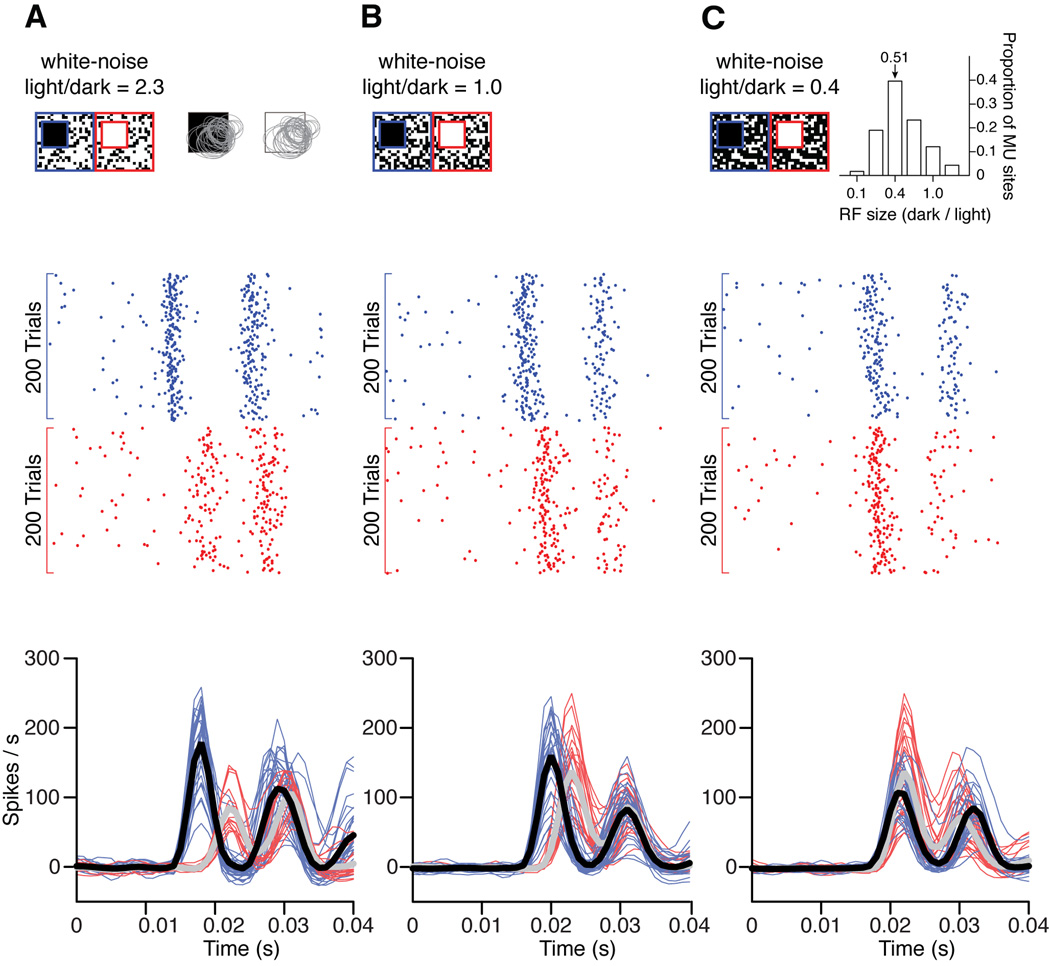
Figure 4. Cortical responses to dark and light targets on noisy backgrounds.
(a) Top panel. The stimuli were large light and dark spots superimposed on a background of binary white noise. The white noise had 2.3 times more light than dark pixels. The dark and light spots were partially superimposed with the population of receptive fields from all cortical sites simultaneously recorded in a single penetration. Gray ellipses are 2D Gaussian fits to cortical receptive fields mapped with sparse noise stimuli. Middle panel. Rasters for 200 trials from a single cortical site in response to dark (blue) and light stimuli (red). Bottom panel. Cortical responses to the stimuli shown at the top, illustrated as PSTHs smoothed with a Gaussian kernel (width = 5 ms). Thin lines show responses of individual recording sites to dark (blue) and light (red) spots and thick lines show the average responses (black for dark spots and gray for light spots). (b) Same as in a, but using white noise with equal number of light and dark pixels. Notice that dark spots generated faster responses than light spots in both a and b. (c) Same as a and b, but using white noise with 0.4 times less light pixels than dark pixels. Notice that the white-noise light/dark ratio had to be reduced for dark and light stimuli to generate responses with similar latency. Interestingly, the value of the light/dark ratio for white noise was similar to the mean dark/light ratio for cortical receptive field size (inset, see methods). The double-peak PSTH is a slow oscillation that we observed when stimulating cortical layer 4 with large stimuli.

