. 2014 Apr 9;3:e01944. doi: 10.7554/eLife.01944

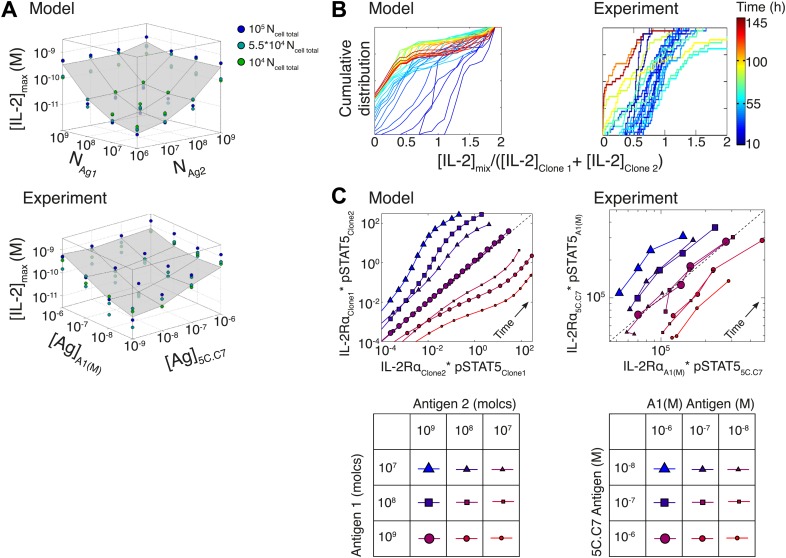
Figure 10. Testing the model of IL-2 regulation through mixed culture of two T cell clones.

5C.C7 and A1(M) TCR transgenic T cells were cultured at varied precursor frequencies (5.103 and 5.104 T cells/well) with titrated concentrations (10−6/10−7/10−8 M) of cognate antigens (K5 and HY peptides) pulsed on separate splenocytes. Graphs show two experiments and are representative of three experiments. (A) Model predictions (top) and experimental validation (bottom) of [IL-2]max for mixed cultures. Color represents total number of T cells (5.103 + 5.103, 5.103 + 5.104, 5.104 + 5.104). (B) Model (left) and experimental (right) cumulative distributions of the ratio of [IL-2] accumulated by the mixed culture to the sum of [IL-2] accumulated independently by each clone over all conditions. (C) Model prediction (left) and experimental validation (right) that pSTAT5 response to shared IL-2 can resolve the relative activating doses of antigen for 5.104 cells of each clone. Marker shape: [Antigen1] = [K5], marker size: [Antigen2] = [HY], color: ratio [K5]/[HY].

DOI: http://dx.doi.org/10.7554/eLife.01944.014

Figure 10.

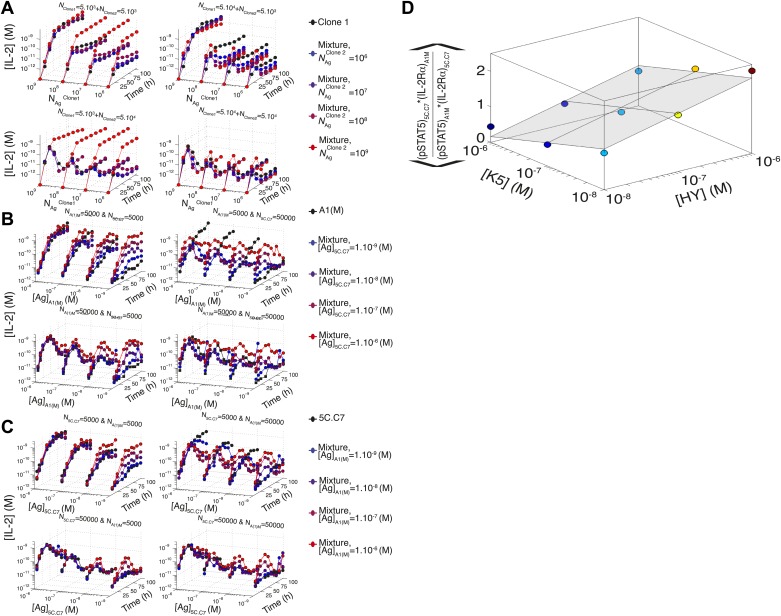
Figure 10—figure supplement 1. Additional computational predictions and experimental validation for a mixed culture of two T cell clones.

Figure 10—figure supplement 1.

(A) Model prediction of the temporal dynamics of IL-2 accumulation by a mixture of two different clones of T cells. For given numbers of clone 1 and clone 2 cells in the mixture (indicated at the top of each box), the temporal kinetics of [IL-2] in the 200 µl medium are plotted for combinations of varied doses of antigen 1 (y-axis) and antigen 2 (indicated by the line color). Due to the symmetry in the model between clone 1 and clone 2, we present temporal [IL-2] dynamics with respect to clone 1 only. (B) Experiment: temporal dynamics of IL-2 are plotted as in (A) for different numbers of T cells from 5C.C7 and A1(M) TCR transgenic mice with varied doses of K5 antigen. (C) Experiment: temporal dynamics of IL-2 are plotted as in (A) for different numbers of T cells from 5C.C7 and A1(M) TCR transgenic mice with varied doses of HY antigen. (D) Scaling for the inhibitory cross-talk between TCR and IL-2 signaling for a mixed culture of 5C.C7 and A1(M) T cells (see ‘Materials and methods’ for details).