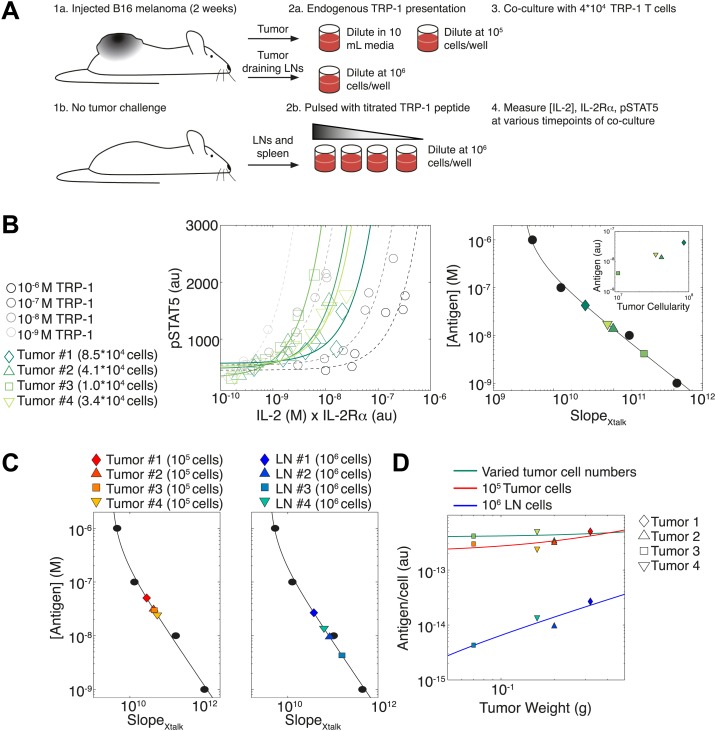
Figure 11. Applying antigen-driven inhibition of IL-2 signaling to estimate tumor antigenicity.
(A) Schematic of experimental design. (B) Left: pSTAT5 increase over the first 52 hr of culture as a function of IL-2 and IL-2Rα for titrated TRP1 peptide pulsed on C57BL/6 splenocytes (Calibration Series, gray) and tumor samples diluted in equivalent volumes (Sample Series, green). Trajectories were fit with the equation Graphs are representative of four experiments. Right: antigen dose as a function of , as established by Calibration Series (black). Calibration curve allows estimation of effective antigenicity of tumor samples. Antigenicity of tumors scales with tumor cellularity (insert). (C) Back-calculated antigenicity for 105 cells of each mouse’s tumor (left) and 106 cells of each mouse’s tumor draining lymph nodes (right). (D) Correlation of tumor weight to estimations of antigen presentation per cell for each tissue.

