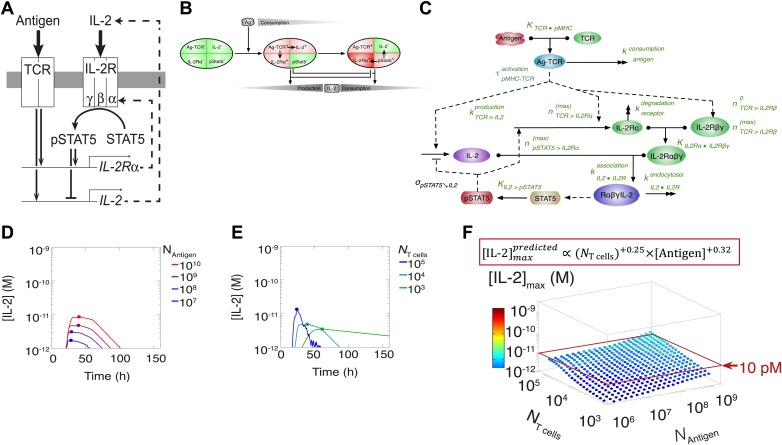
Figure 3. Shortcomings of the classical model of the IL-2 pathway.
(A) Sketch of the classical pathway for IL-2 secretion and consumption. (B) Cartoon representation of progression through cellular states during production and consumption of IL-2: from naive (IL-2Rα−, IL-2−) to activated IL-2 producers (IL-2Rα+, IL-2+ and IL-2Rα+) and finally to IL-2 consumers (IL-2Rα++, IL-2−). (C) Biochemical model of IL-2 regulation as described in the literature (‘classical model’); parameters in green are derived from experiments. Classical model prediction of IL-2 dynamics for (D) 104 T cells stimulated with varied quantities of antigen and (E) varied numbers of T cells stimulated with 108 molecules of antigen. (F) Two-dimensional dependency for [IL-2]max as a function of [Antigen] and NTcell, as predicted by the above classical model. The red border represents the theoretical 10 pM ceiling of [IL-2] that cells can secrete before switching off IL-2 secretion.

