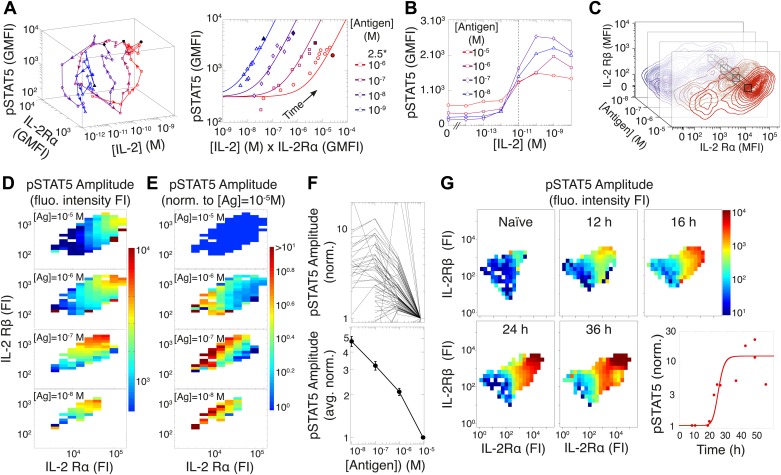
Figure 4. Experimental characterization of the antigen-driven inhibition of IL-2 signaling.
(A) Dynamics of IL-2 pathway over 150 hr (arrows indicate progression in time) for 105 5C.C7 T cells activated in vitro by splenocytes pulsed with varied [K5] antigen (left). STAT5 phosphorylation was measured as the geometric mean fluorescence intensity (GMFI) at different times before reaching the maximal [IL-2] concentration (filled symbol), and correlated with the product of [IL-2] and IL-2Rα GMFI for activated cells (right, representative of more than four experiments). (B) STAT5 phosphorylation in response to exogenous IL-2 for cells 48 hr post activation with splenocytes pulsed with varied doses of antigen. pSTAT5 is reported as GMFI for all activated IL-2Rα+ T cells. (C) Distributions of the abundance of IL-2Rα and IL-2Rβ at 48 hr post activation with splenocytes pulsed with varied doses of antigen. Cell-to-cell variability analysis (CCVA) parses these distributions to compare the signaling responses among populations of cells (bins) defined by set levels of IL-2Rα and IL-2Rβ (e.g., black cross-section across antigen doses). (D) and (E) Cell-to-cell variability analysis, see Experimental Procedures for details. pSTAT5 responses for cultures in (C) were parsed according to binned levels of IL-2 receptors. Amplitudes of pSTAT5 for 10 nM ≤ [K5] ≤ 10 µM for each IL-2Rα/IL-2Rβ bin were presented (D) as fluorescence intensity (FI) or (E) as a FI normalized to the pSTAT5 amplitude for [K5] = 10 µM. (F) Normalized pSTAT5 amplitude are reported for individual bins of IL-2Rα and IL-2Rβ levels (top) or averaged across all IL-2Rα and IL-2Rβ levels (bottom). Error bars are computed as the SEM across all bins. (G) Cell-to-cell variability analysis of pSTAT5 response to IL-2 for varied levels of IL-2Rα and IL-2Rβ at different time points. Inset: time dependence of the average pSTAT5 amplitude measured for individual bins of IL-2Rα and IL-2Rβ over time (n = 3 independent experiments).

