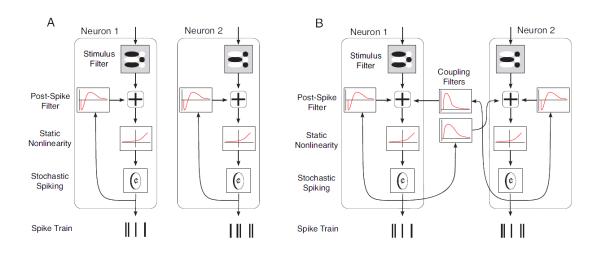
Figure 2. Schematics of the two input/output models.

A. The independent model. In this model, each neuron within the population is represented by a separate cascade. To generate each neuron's output, the input is convolved with a linear filter. The output of the convolution is then added to the output of a second filter which is convolved with the cells' spiking history. Finally, a static nonlinearity is applied to the combined linear filter output, yielding a rate function for a Poisson spike generator. B. The coupled model. In the coupled model, the cascades are interconnected - that is, the spiking output of each cell undergoes convolution with neighboring cells' coupling filters, and the result combines additively with the input signal for the neurons.
