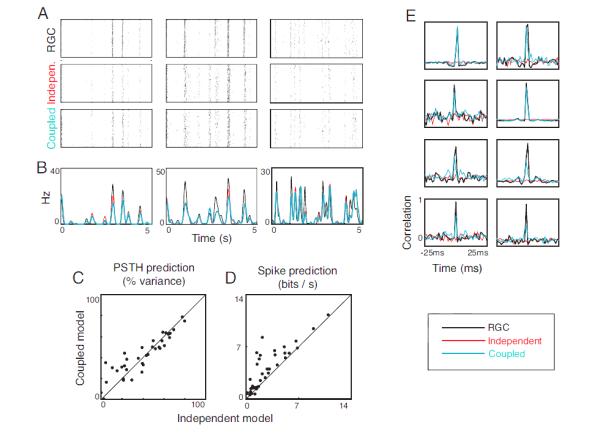
Figure 3. Model performance for white noise stimuli.

A. Recorded responses from three representative retinal ganglion cells (RGCs) to repeats of an out-of-sample binary white noise stimulus (top), along with responses derived from the independent model (middle) and the coupled model (bottom). B. Corresponding PSTH’s of the ganglion cell responses (black), the independent model output (red), and the coupled model output (blue). C. Quality of PSTH prediction by independent and coupled models across the three retinas. Coupling yields no advantage in predicting the average response. D. Log-likelihoods of ganglion cell responses for the independent and coupled models. The coupled model is better able to explain individual spike trains. E. Representative shift-corrected cross-correlograms for pairs of ganglion cells (black) and for the independent (red) and coupled models (blue). The coupled model is able to capture the correlated activity, while the independent model is not.
