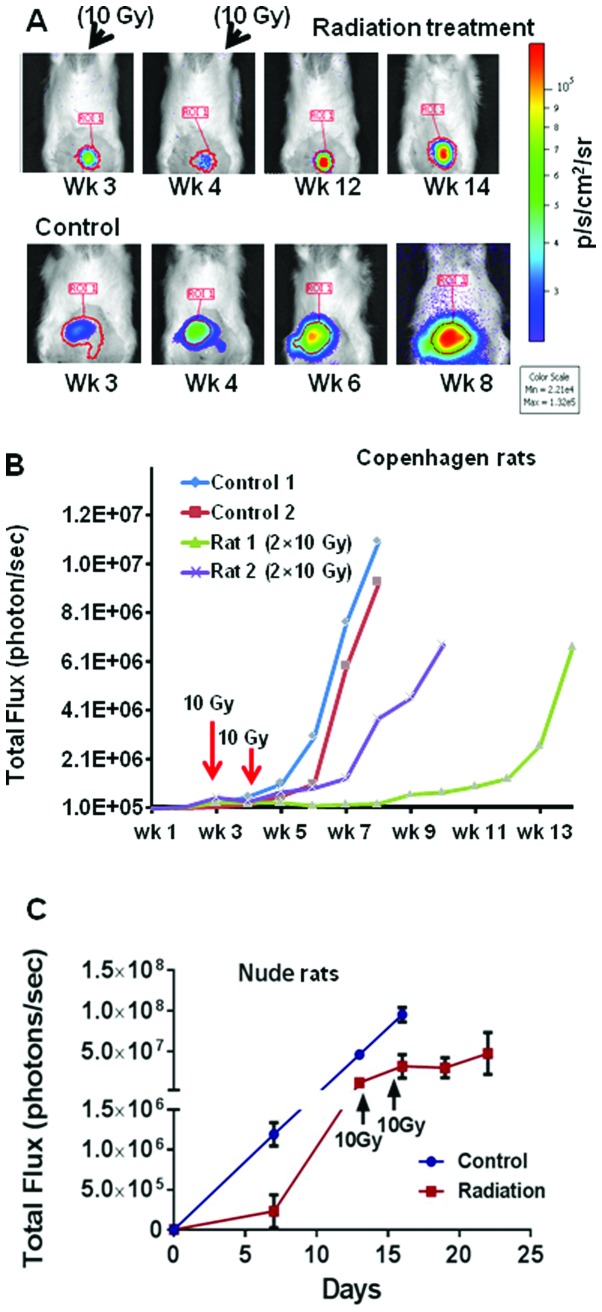
Figure 4.
(A) The upper panel displays the tumor growth (rat 1) throughout the treatment course. The lower panel displays with the course of an untreated rat (control 1). The heat scale is given in signal intensity per unit area (p/s/cm2/sr). (B and C) Tumor growth curve (control and radiation treated) of the (B) Copenhagen rats and (C) Nude rats obtained by integrating the BLI signal (total Flux) over a region of interest. Arrows indicate the days when radiation was delivered.

