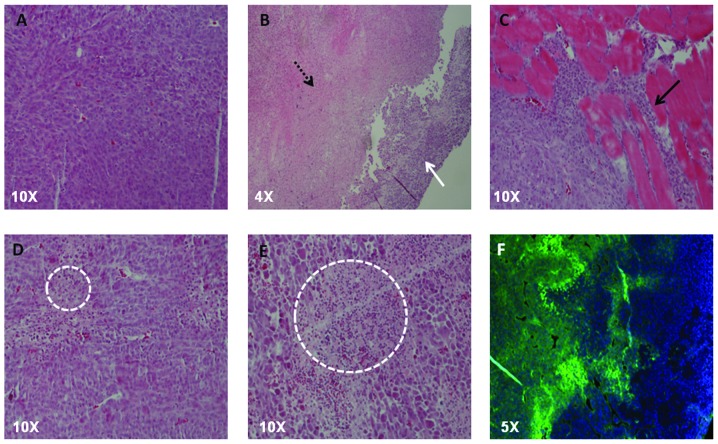
Figure 5.
(A) H&E stained tissue section from a non-irradiated control; PC3-KD tumors are highly anaplastic and aggressive with high nuclear to cytoplasmic ratios, loss of cell polarity and loss of glandular structure. (B) H&E stained tissue section from an irradiated tumor. The irradiated area is highly necrotic (black dash arrow) displaying loss of cellular structure and high levels of eosin staining as compared to a strip of unirradiated tissue (white arrow). (C) H&E section of tumor showing invasion into adjacent skeletal muscle, the black arrow delineates tumor cells invading longitudinally down a skeletal muscle fascicle. (D) H&E section notable for areas of apoptosis. Apoptotic cells are noted for the loss of cellular detail as well as pyknotic nuclei (white dashed circle). (E) H&E image of radiated sections of tumor showing infiltration by neutrophils and macrophages in the early periods are radiation (white dashed circle), these areas will eventually become fibrotic. (F) Immunofluorescence using FITC conjugated antibodies against pimonidazole. Areas that are stained green represent areas of hypoxia, blue areas represent cell nuclei (DAPI). PC3-KD tumors show strong areas of central core hypoxia.

