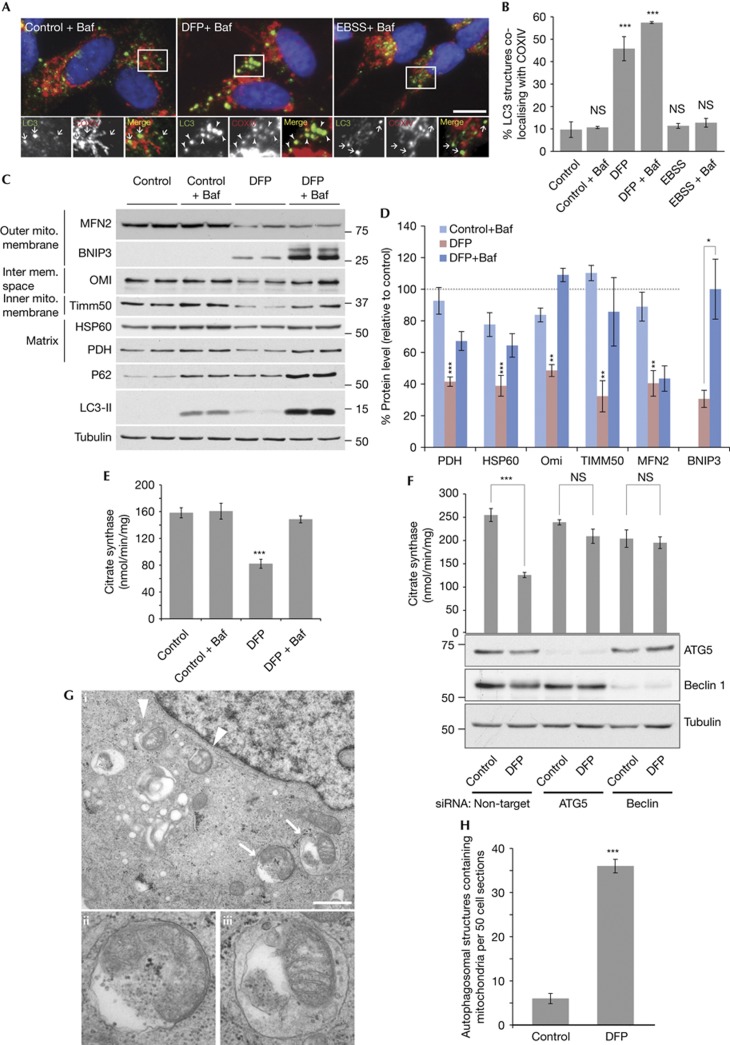
Figure 2.
Loss of iron induces mitophagy. (A) Representative images and (B) quantitation of SH-SY5Y cells stained with LC3 and COXIV antibodies, 1 mM DFP treatment for 16 h, EBSS (amino-acid starvation) for 2 h and 50 nM bafilomycin A1 for final 2 h of treatment. Arrows indicate non co-localized LC3 puncta and arrowheads co-localized puncta. Scale bar, 10 μm. (C) Example immunoblot and (D) Quantitation of mitochondrial proteins and autophagy markers in SH-SY5Y cells treated with 1 mM DFP for 24 h, 50 nM bafliomycin A1 was added for final 16 h of treatment. Data relative to control condition - dotted line represents control value (100%). (E) Citrate synthase activity following 1 mM DFP treatment for 24 h, 50 nM bafilomycin A1 was added for final 16 h of treatment. (F) Citrate synthase activity in HeLa cells after 1 mM DFP treatment for 24 h in cells transfected with siRNA against autophagy genes ATG5 or Beclin1. (G) Electron micrographs and (H) quantitation from SH-SY5Y cells treated under control conditions or with 1 mM DFP for 16 h each with 50 nM bafilomycin A1 for final 2 h of treatment. Arrows/arrowheads represent mitochondria surrounded by a limiting membrane. Structures labelled by arrows in panel i are shown magnified in ii (autophagosome) and iii (autolysosome). Scale bar represents 0.9 μm. All results are from three independent experiments. All quantitative data are mean±s.e.m. *P<0.05, **P<0.01, ***P<0.001, NS, not significant. Baf, bafilomycin A1; DFO, deferoxamine; DFP, deferiprone; EBSS, Earle’s balanced salt solution; GFP, green fluorescent protein; siRNA, small interfering RNA.
Source data for this figure is available on the online supplementary information page.

