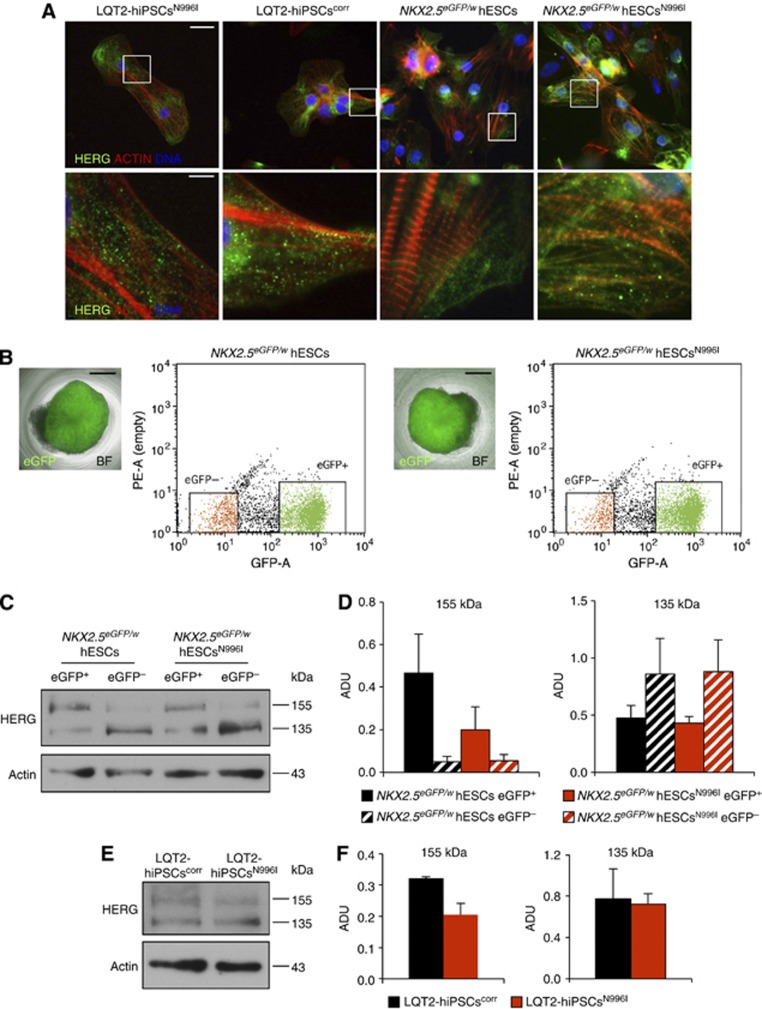
Figure 8.
Trafficking defect in CMs harbouring the c.A2987T (N996I) KCNH2 mutation. (A) lmmunofluorescence images of HERG channel (green) and actin (red) in representative human CMs derived from mutated and corrected LQT2-hiPSCs, and from wild-type and mutated hESCs. Nuclei are stained in blue. Bottom panels are a magnification of the area framed in the upper corresponding images. Top panels, scale bar: 25 μm; bottom panels, scale bar: 5 μm. (B) Flow cytometry purification of NKX2.5 eGFP+ and NKX2.5 eGFP− hESC population from embryoid bodies differentiated from wild-type (left) and mutated (right) hESCs. The pictures show an individual eGFP-expressing (green) embryoid body; BF: bright field; scale bars: 400 μm. The representative dot plots show flow cytometric isolation of eGFP+ (green) and eGFP− (orange) cell populations. (C) Representative western blot analysis of HERG protein in eGFP+ and eGFP− cell populations purified from differentiated wild-type and mutated hESCs. Core- and complex-glycosylated HERG (135 and 155 kDa, respectively) are indicated. Actin is shown as a loading control. (D) Densitometric quantification of the 155-kDa and 135-kDa bands corresponding to the complex- and core-glycosylated HERG channel, respectively; ADU: arbitrary densitometric units; values are presented as mean±s.e.m., n=4. (E) Representative western blot analysis of HERG protein in LQT2-hiPSCscorr- and LQT2-hiPSCsN996I-derived CMs. Core- and complex-glycosylated HERG (135 and 155 kDa, respectively) are indicated. Actin is shown as a loading control. (F) Densitometric quantification of the 155-kDa and 135-kDa bands corresponding to the complex- and core-glycosylated HERG channel, respectively; ADU: arbitrary densitometric units; values are presented as mean±s.e.m., n=2.
Source data for this figure is available on the online supplementary information page.

