Figure 2.
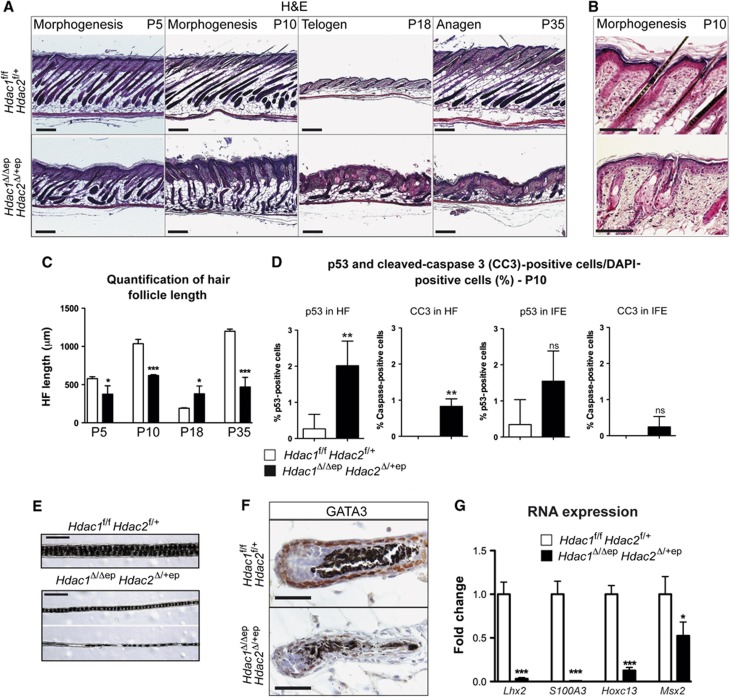
Progressive hair loss and deregulated HF development in Hdac1Δ/Δep Hdac2Δ/+ep mice. (A) H&E staining of back skin sections from control and Hdac1Δ/Δep Hdac2Δ/+ep mice at P5, P10, P18 and P35. Scale bar: 200 μm. (B) Higher magnification of H&E staining of back skin sections from control and Hdac1Δ/Δep Hdac2Δ/+ep mice at P10. Scale bar: 200 μm. (C) Quantification of the hair follicle length of back skin hair from control and Hdac1Δ/Δep Hdac2Δ/+ep littermates at different stages. n=3; P=0.0353, 0.0002, 0.0336 and 0.0006. (D) p53 and cleaved caspase 3-positive (CC3) cells as a fraction of DAPI-stained cells in the HF and in the IFE. n=4; P=0.0045, 0.001, 0.0690 and 0.2060. (E) Brightfield image of back skin hair from littermate control and Hdac1Δ/Δep Hdac2Δ/+ep mice (P35). Scale bar: 100 μm. (F) Back skin HF (anagen, P10) of control and Hdac1Δ/Δep Hdac2Δ/+ep littermates was stained with an antibody against GATA3. Nuclei were counterstained with Mayer’s hemalaun. Scale bar: 50 μm. (G) Relative mRNA expression of genes important for hair development. n=3–4, P=0.001, 0.0003, 0.0001 and 0.0326. (C, D, G) Data represent means±s.d.

