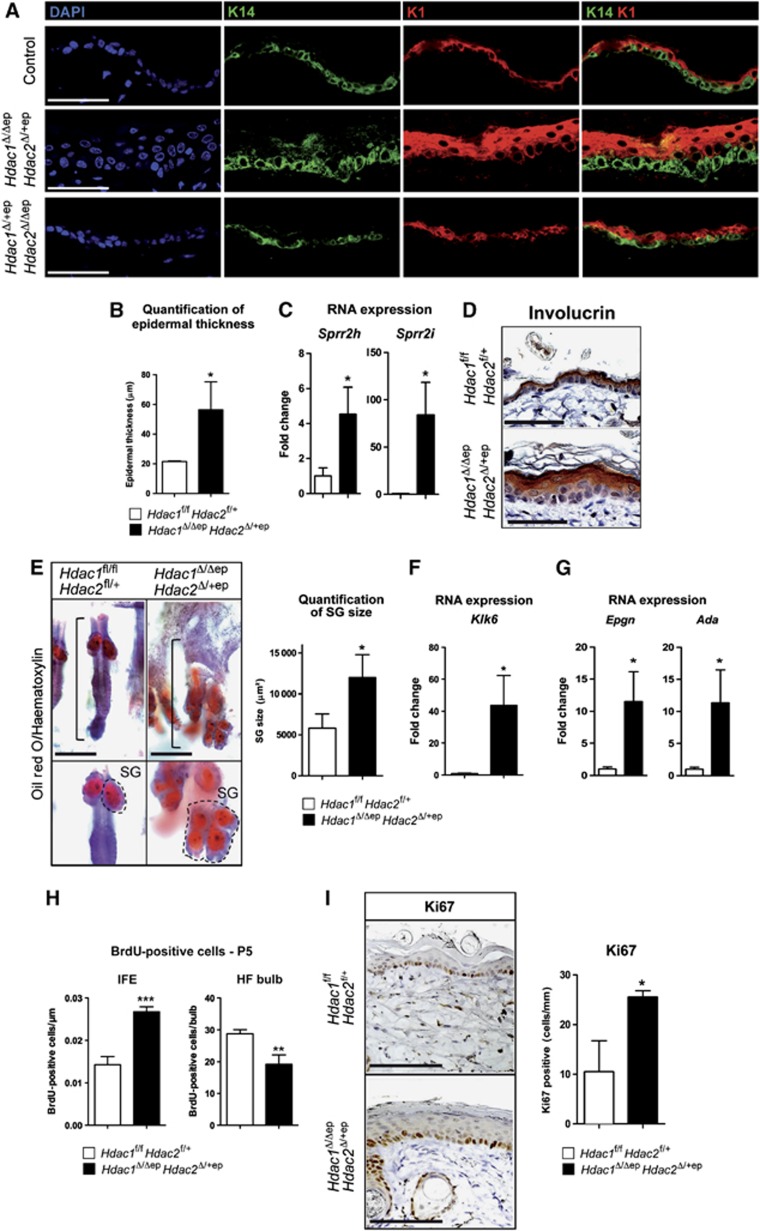
Figure 3.
Hdac1Δ/Δep Hdac2Δ/+ep mice display impaired epidermal development and hyperkeratosis. (A) IF analysis of back skin sections of adult control, Hdac1Δ/Δep Hdac2Δ/+ep and Hdac1Δ/+ep Hdac2Δ/Δep mice (P35) with antibodies specific for K14 and K1. Nuclei were counterstained with DAPI. Scale bar: 50 μm. (B) Quantification of epidermal thickness as shown in (A) in littermate controls and Hdac1Δ/Δep Hdac2Δ/+ep mice. n=3. P=0.0150. (C) qRT–PCR analysis of mRNA expression of Sprr genes in the epidermis from Hdac1Δ/Δep Hdac2Δ/+ep and control littermates. n=3. P=0.0190 and 0.0139. (D) IHC analysis of control and Hdac1Δ/Δep Hdac2Δ/+ep back skin sections for involucrin (P35). The nuclei were counterstained with Mayer’s hemalaun. Scale bar: 100 μm. (E) Brightfield images of Oil red O and haematoxylin-stained skin whole mounts of control and Hdac1Δ/Δep Hdac2Δ/+ep mice (P90). Dashed line marks SG, straight line marks HF unit. Scale bar: 200 μm. SG areas for individual HF were quantified and shown on the right panel. n=30. P=0.0315. (F) Relative mRNA expression of the kallikrein-related peptidase 6. n=3. P=0.0165. (G) qRT–PCR analyses of Epgn and Ada in the epidermis of control and Hdac1Δ/Δep Hdac2Δ/+ep mice. n=3. P=0.0122 and 0.0250. (H) Quantification of IF signals for BrdU in HF (left panel) and IFE (right panel) of control and Hdac1Δ/Δep Hdac2Δ/+ep mice (P5) after 2 h BrdU labelling. n=4. P=0.0007 and 0.0068. (I) IHC analysis for the proliferation antigen Ki67 in control and Hdac1Δ/Δep Hdac2Δ/+ep tail skin (P30). Scale bar: 100 μm. Quantification of Ki67-positive cells in tail epidermis is shown on the right. n=3. P=0.0150. (B–I) Mean value with s.d. is shown.

