Figure 4.
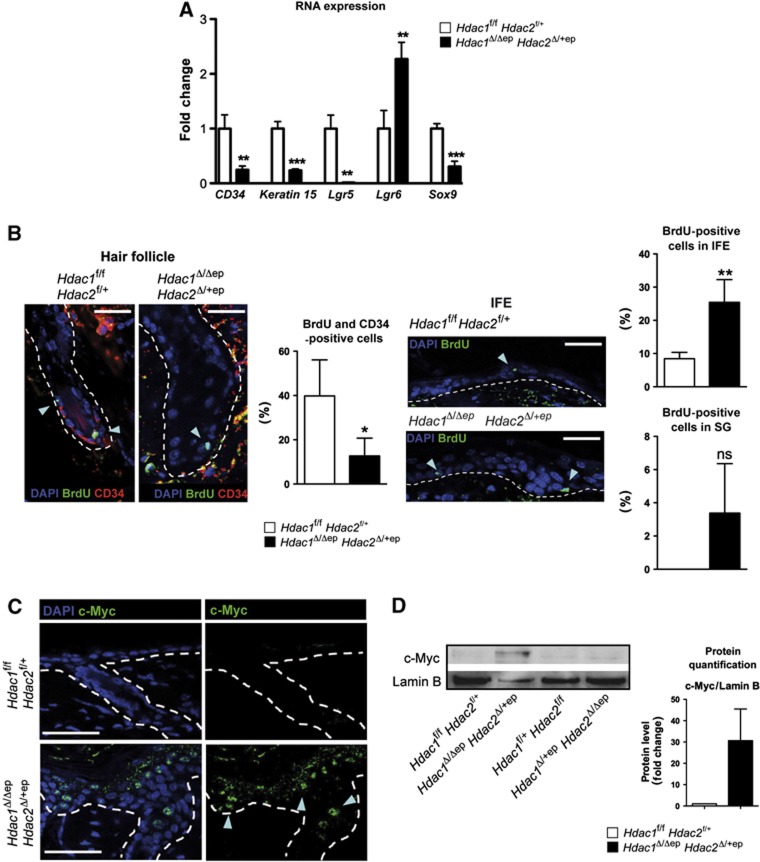
Epidermal hyperproliferation, deregulated epidermal lineage commitment and c-Myc activation in Hdac1Δ/Δep Hdac2Δ/+ep mice. (A) Relative mRNA expression of epidermal stem-cell markers in tail epidermis from control and Hdac1Δ/Δep Hdac2Δ/+ep littermates. n=3–4. P=0.0054, 0.0006, 0.0022, 0.0081 and 0.0008. (B) IF co-staining of label-retaining (BrdU+) bulge cells (CD34) in HF (left panels) and IFE (right panels) of control and Hdac1Δ/Δep Hdac2Δ/+ep mice (P34) after 72 h BrdU pulse (P6) and 25 days chase. Nuclei were counterstained with DAPI. Scale bar: 100 μm. Quantification of BrdU is shown on the right of each staining picture. n=4. P=0.0241, 0.0030 and 0.0646. (C) Back skin sections of control and Hdac1Δ/Δep Hdac2Δ/+ep mice (P30) labelled with an antibody against c-Myc. Nuclei were counterstained with DAPI. Scale bar: 50 μm. (D) Expression of c-Myc in epidermal tail nuclear cell extracts of control, Hdac1Δ/+ep Hdac2Δ/Δep and Hdac1Δ/Δep Hdac2Δ/+ep mice was analysed on immunoblots. Lamin B served as a loading control. Immunoblot signals of control and Hdac1Δ/Δep Hdac2Δ/+ep mice were quantified by densitometric scanning are shown relative to the Lamin B signal on the right of the panel. n=3. (A, B, D) Error bars indicate s.d.
Source data for this figure is available on the online supplementary information page.

