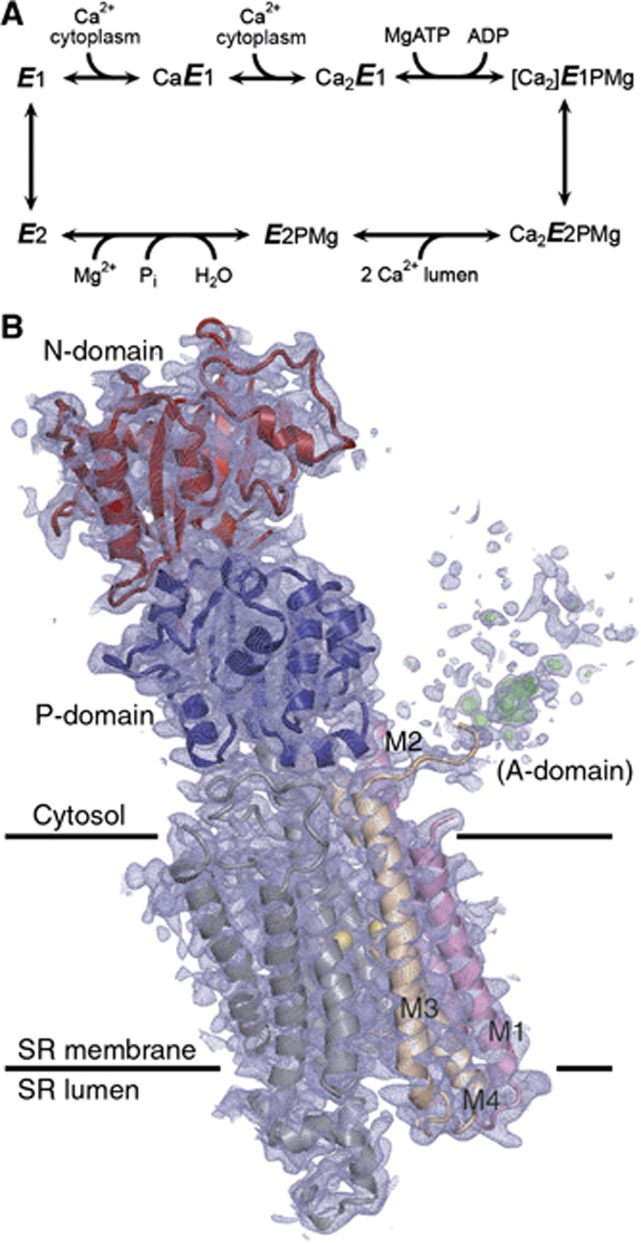
Figure 1.
SERCA reaction cycle and crystal structure of the mutant E309Q in the Ca2E1 state. (A) Ca2+-ATPase reaction cycle. Major conformational changes and substrate binding and dissociation steps are shown. (B) The crystal structure of E309Q. Final electron density after refinement is shown as blue (2mFo-DFc, 0.7 σ) and green (mFo-DFc, 2.7 σ, for clarity only shown for A-domain region) mesh. N-domain depicted in red and P-domain in blue. M1–M2 is shown in pink, M3–M4 in beige, M5–M10 in grey, and Ca2+ ions as yellow spheres.

