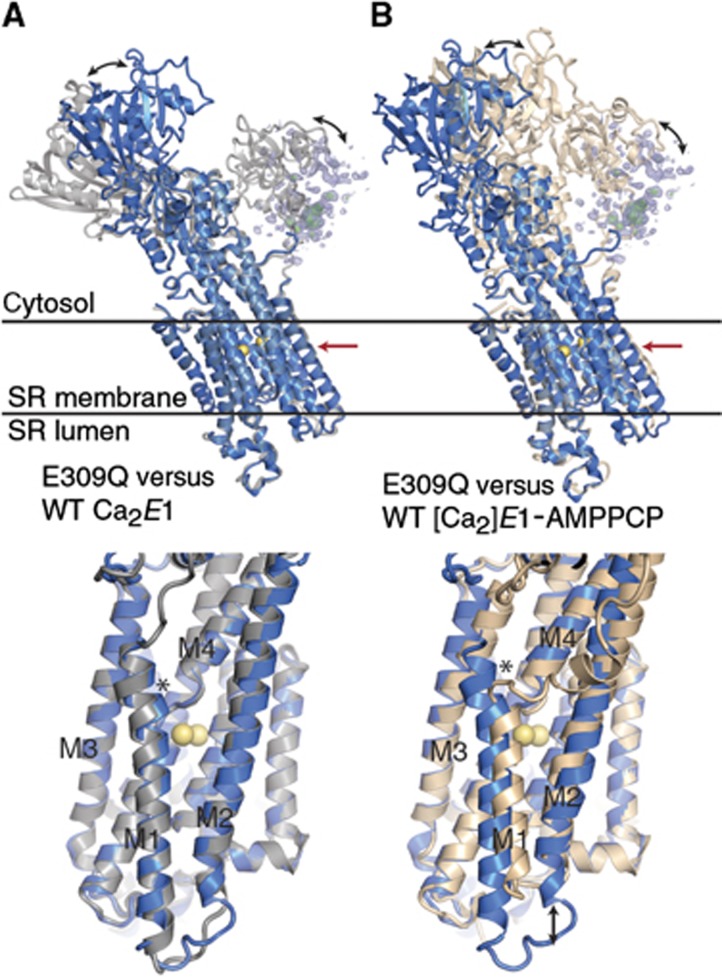
Figure 2.
Superposition of the E309Q structure with the structures of wild type in Ca2E1 and [Ca2]E1-AMPPCP states. E309Q depicted in blue, wild-type Ca2E1 (PDB 1SU4; Toyoshima et al, 2000) in grey (A), and wild-type Ca2E1-AMPPCP (PDB 1T5S; Sørensen et al, 2004) in wheat (B). E309Q A-domain electron density is shown in blue (2mFo-DFc, 0.7 σ) and green (mFo-DFc, 2.7 σ) mesh. Black arrows in the top and lower panels indicate significant differences in cytosolic domain and M1/M2 helice bundle positions, respectively. The lower panels show details of the transmembrane domains, viewed in the direction of the red arrows in the top panels. The asterisk in (A) indicates the position shift of M1 and in (B) the position of the M1 kink near Leu61 present in the wild-type[Ca2]E1-AMPPCP state, but absent in the E309Q Ca2E1 structure.

