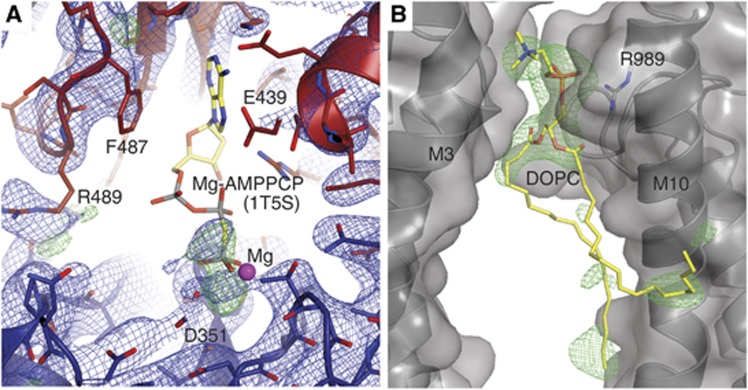
Figure 4.
Details of the nucleotide and lipid binding sites in the E309Q structure. (A) N-domain depicted in red, P-domain in blue, and electron density as blue (2mFo-DFc, 1.0 σ) and green (mFo-DFc, 3.0 σ) mesh (the refined model does not include a nucleotide). The AMPPCP β- and γ-phosphates of the superposed wild-type [Ca2]E1-AMPPCP structure (PDB 1T5S) roughly overlap with the electron density peaks in E309Q. (B) The DOPC binding site, positioned in a groove between two ATPase molecules, with the phosphate moiety of the lipid head group being coordinated by Arg989. Green mesh: mFo-DFc SA-omit map at 3.0 σ. Note that the two labelled helices are from adjacent SERCA molecules in the crystal.

