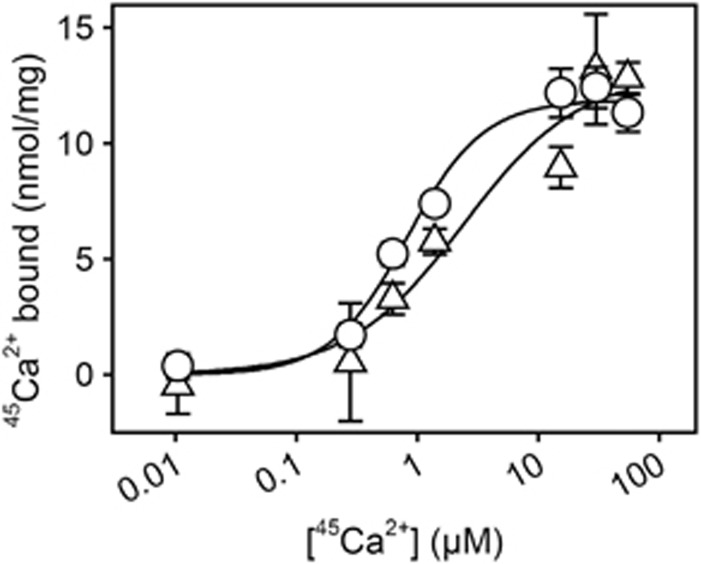
Figure 7.
Equilibrium 45Ca2+ binding measurements. 45Ca2+ binding to deoxycholate-purified native sarcoplasmic reticulum vesicles and to DOPC-reconstituted yeast-expressed E309Q was measured by filtration. Filters, deposited with the protein samples, were perfused with 20 ml medium containing 100 mM MOPS/Tris (pH 7.2), 100 mM KCl, 1 mM MgCl2, 55 μM CaCl2 with radiolabelled 45Ca2+, and various concentrations of EGTA, giving the free 45Ca2+ concentrations indicated on the abscissa. Circles, wild type; triangles, E309Q. The lines show the best fits of the Hill equation, Y=Ymax · [Ca2+]h/(K0.5h+[Ca2+]h), to the data giving the following affinity constants (K0.5) and Hill coefficients (h): wild type, K0.5=0.82±0.16 μM, h=1.38 (n=2, 28 data points); E309Q, K0.5=2.42±1.96 μM, h=0.91 (n=2, 28 data points). In each Hill fit, the Ymax was defined by the amount of 45Ca2+ bound following perfusion with EGTA-free medium (hence, with 55 μM free Ca2+).

