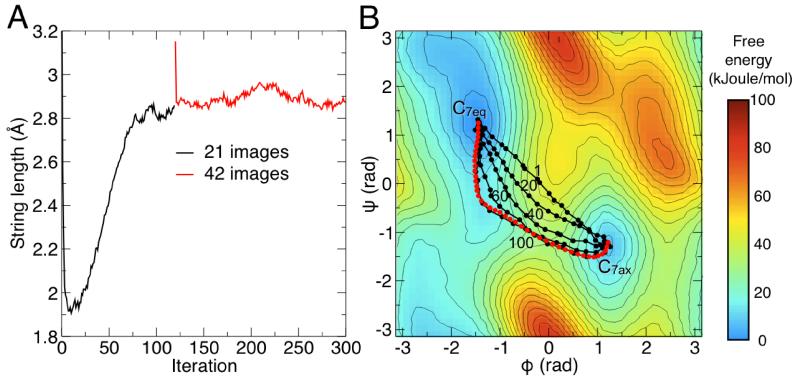
Figure 3. Convergence of the string to the minimum free-energy path.
(A) Evolution of the string length as a function of the iteration number. The string was initially defined with 21 images (black line); after convergence, the iterations were resumed after doubling the number of images (red line). (B) Evolution of the string, projected onto the space of the Ramachandran dihedral angles Φ and Ψ. For clarity only 5 iterations are displayed, along with the iteration number. The projection of the average string over the last 30 iterations from consisting of 42 images is displayed in red. The standard deviation of this average is less than 3 · 10−2 rad in both Φ and ψ. A free-energy landscape in the space of Φ and Ψ, obtained with umbrella-sampling simulations, is shown in the background. Isolines reflect increments of 5 kJoule/mol.

