
Figure 7.
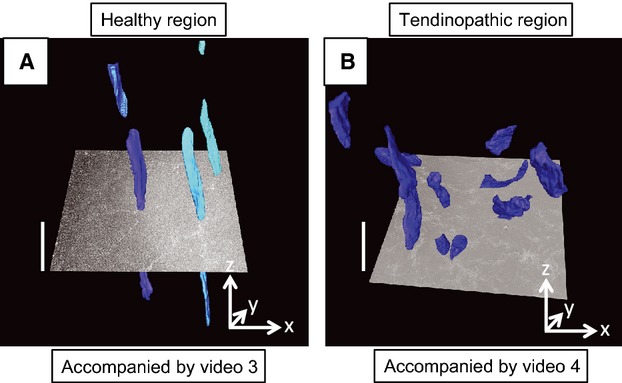
Three-dimensional organization of tenocytes in healthy and tendinopathic regions. (A) Healthy tendon. Nuclei are shown in different hues of blue and are aligned parallel to the tendon long axis. (B) Tendinopathic region of tendon. Nuclei are distributed almost randomly in three-dimensions. The images are frame shots of Videos S3 and S4. An electron microscope image is shown superimposed on the 3D reconstructions. The sizes of the images are 40 × 40 μm (x–y-axes). The scale bars on the z-axis (i.e. parallel to the tendon long axis) are 10 μm.