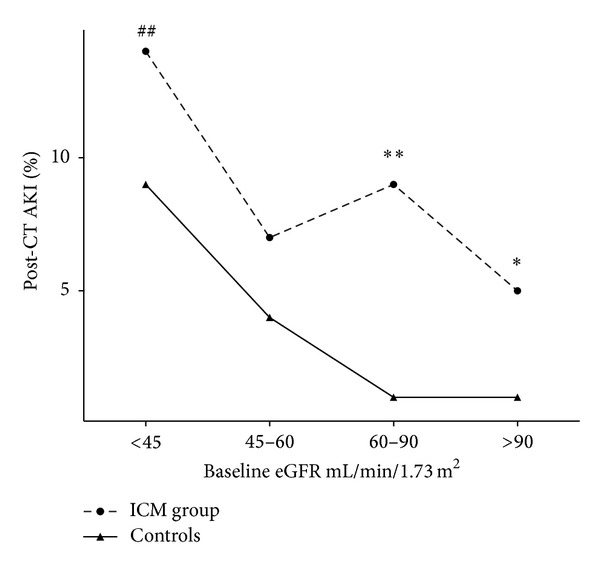
Figure 1.

Percentage of patients developing post-CT AKI in the ICM group compared to controls. Using Fisher's exact test: *P < 0.05 and **P < 0.001, comparing the ICM group versus controls and ## P < 0.005 comparing to patients with a baseline GFR > 90 mL/min/1.73 m2.
