
Figure 2.
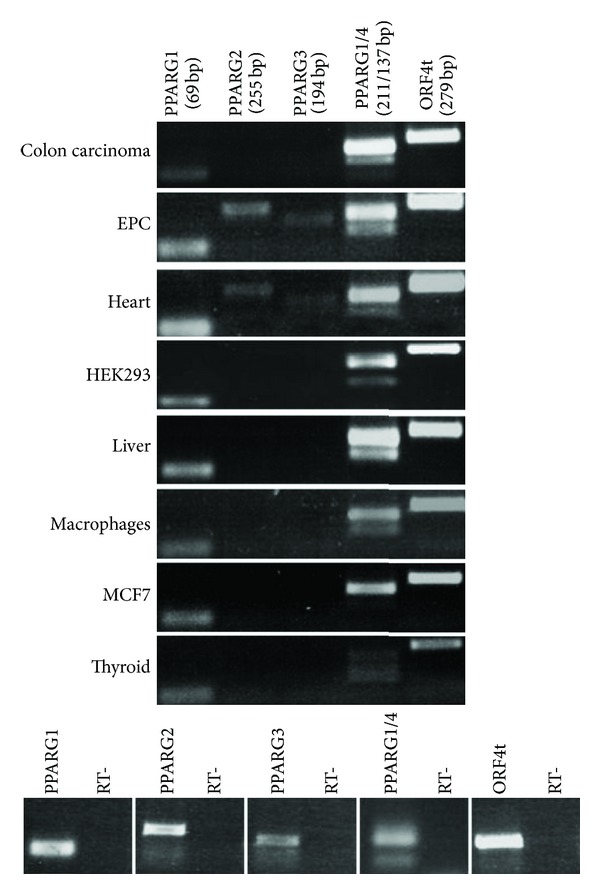
Expression pattern of PPARG variants in tissues and cells affected in the metabolic syndrome. For each PPARG transcript, specific primer pairs were used for PCR reactions. Given the similarity between PPARG1/4 5′UTRs primers amplifies both variants (distinguishable as PCR products of different sizes). “ORF4t” indicates the entire pool of ORF4 transcripts. Amplicons' sizes are shown (in bp) below transcripts' names. On the bottom panel, negative PCR controls are shown for each primer pair.