
Figure 5.
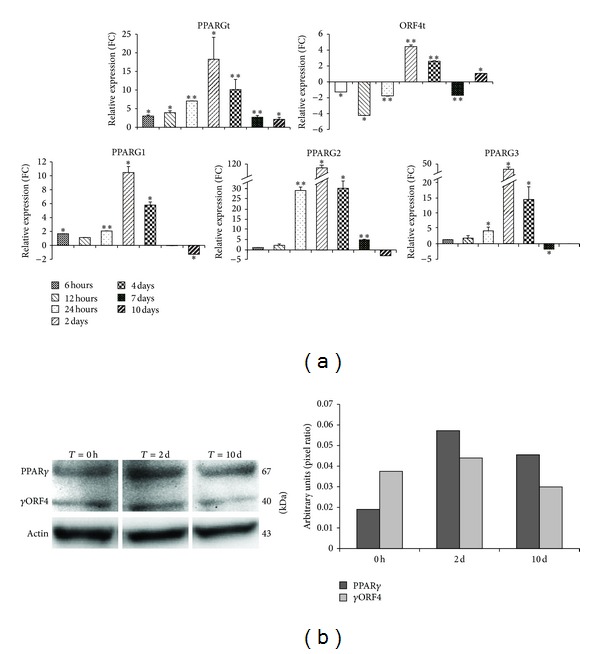
For each analyzed PPARG variant, bar graphs in the Panel (a) indicate the relative expression levels at different time points after in vitro adipocyte differentiation. For each assay, expression is normalized for reference samples (time point at 0 or 6 hours) using GAPDH as housekeeping gene. Data are reported as mean values, and error bars are also reported. P values <0.05 are considered statistically significant and indicated by an asterisk. Double asterisks indicate P values <0.001. In panel (b), total cell lysates of hMSC at day 0, day 2, and day 10 by differentiation induction blotted with anti-PPARγ antibody are shown. To ensure equal protein transfer, membranes were blotted with antiactin antibody. Bar graph indicates the pixel intensity ratio between PPARγ isoforms and actin protein levels, reported as arbitrary units over basal (day 0).