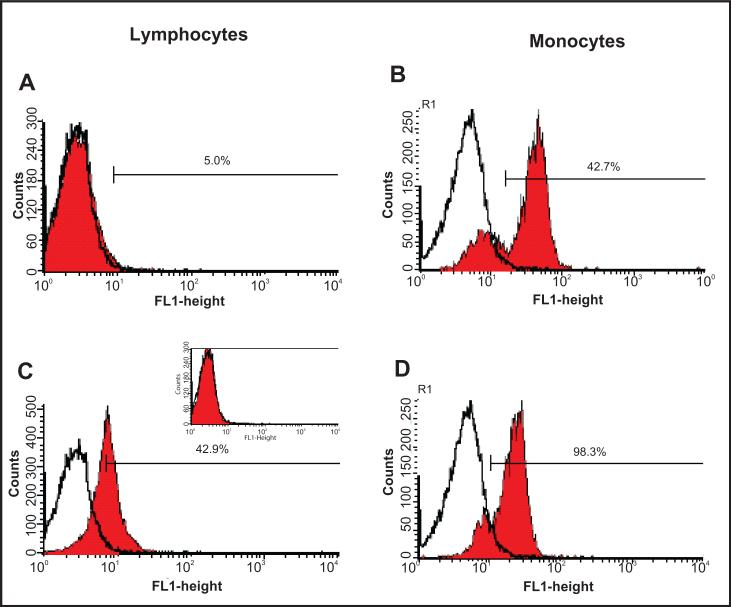
FIGURE 1. Two ex vivo profiles of CXCR1 (A and B) and CXCR2 (C and D) expression on lymphocytes (A and C) and monocytes (B and D) obtained from peripheral blood mononuclear cells of a prior extrapulmonary tuberculosis patient.
Panel A depicts typical CXCR1 expression, but Panel C depicts abnormal spontaneous CXCR2 expression on lymphocytes (Insert: typical CXCR2 expression in controls with latent M. tuberculosis infection). One out of 3 representative and independent experiments is shown. The thick lines show the control isotype. The percentages of positive cells for the respective histograms are indicated in each graphic.

