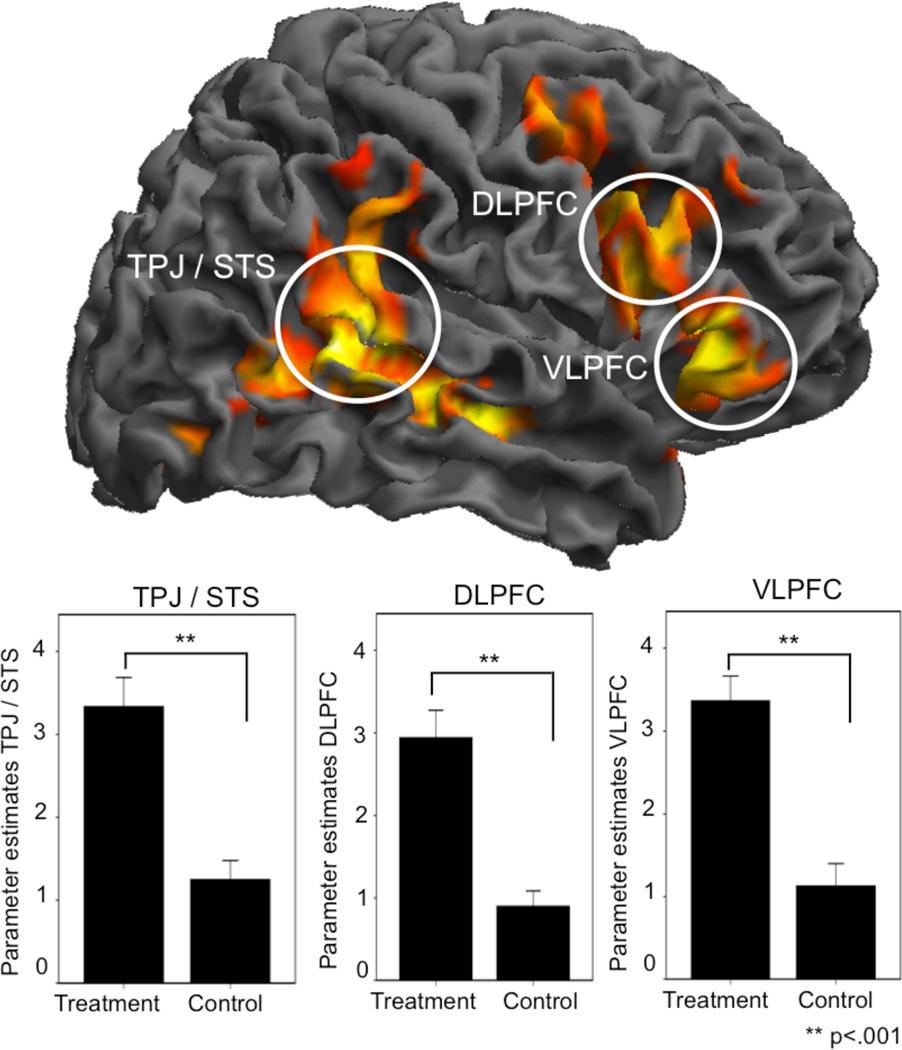
Figure 2.
Physician brain activations during treatment of a patient. The ‘treatment’ condition, compared to the ‘control’ condition, was associated with significantly increased brain activity in four clusters: right DLPFC ([48, 20, 28]), VLPFC ([48, 29, 1]), TPJ/pSTS ([63, −46, 10]) and the cerebellum ([−15, −76, −38]), as illustrated by the rendered brain in this figure. The initial statistical image threshold was p<.005 with 30 contiguous voxels and all results were FWE-corrected at the cluster level. The contrast ‘treatment’ versus ‘control’ was balanced since the physicians got identical visual inputs during both conditions; the patient was not in pain and kept a neutral face during both conditions. The only difference was the physicians’ knowledge that he/she had relieved the patient’s pain during ‘treatment’ whereas the ‘control’ condition did not include any pain application in the first place. The extracted parameter estimates from the peak activations (3 mm sphere) during ‘treatment’ and ‘control’ are represented in the three bar-plots (± 1 Standard Error). A complete list of the significant areas can be found in table 2.

