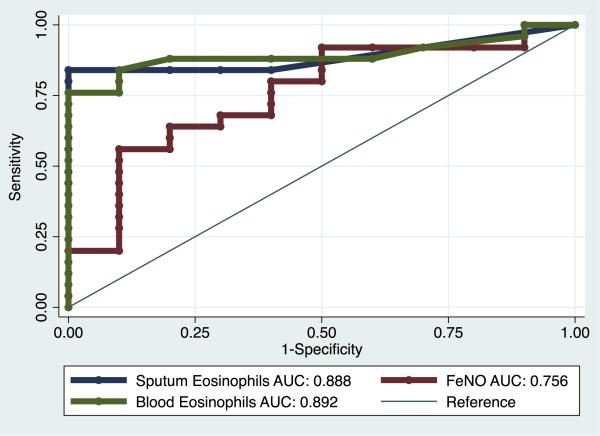
FIG 6.
Receiver operating characteristic (ROC) analysis of peripheral blood eosinophil counts, sputum eosinophil counts, and Feno levels as biomarkers of airway TH2 inflammation, as assessed by using the sputum cell TH2 gene mean. Green line, ROC curve for peripheral blood eosinophil counts; blue line, ROC for sputum eosinophil counts; red line, ROC for Feno values. AUC, Area under the curve.

