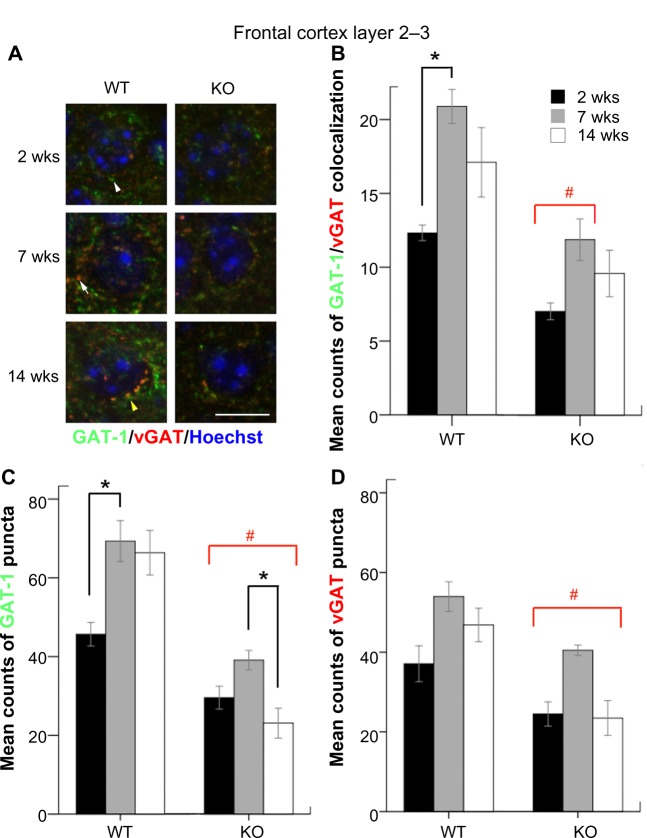
Figure 2.
(A) GAT-1 and vGAT puncta located in the FC are shown under high magnification (scale bar = 10 μm). (B), (C), and (d) The mean counts of GAT-1-vGAT colocalization, GAT-1, and vGAT puncta in the FC were compared according to ages and genotypes.
Notes: # KOs of all ages but excluding 14 weeks KO in B. *a statistical significance of P < 0.05.

