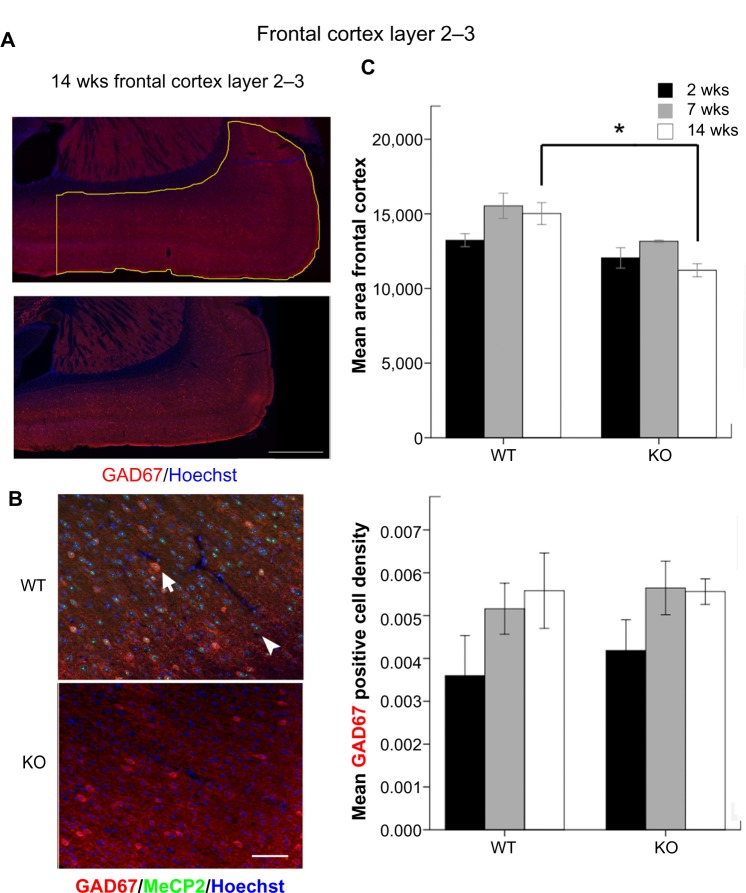
Figure 4.
(A) The outlined area denote the FC at 14 weeks that was used for the calculation of GAD67-positive cell densities (scale bar = 500 μm). The left vertical line was drawn with respect to anterior of lateral ventricle. (B) GAD67 and MeCP2 co-labeling in the FC at 14 weeks (scale bar = 50 μm). (C) Mean area of FC inside the outlined region in Figure 4 A. (d) Mean GAD67-positive cell densities calculated as the total counts of GAD67-positive cells in the defined regions divided by their pixel squared area.

