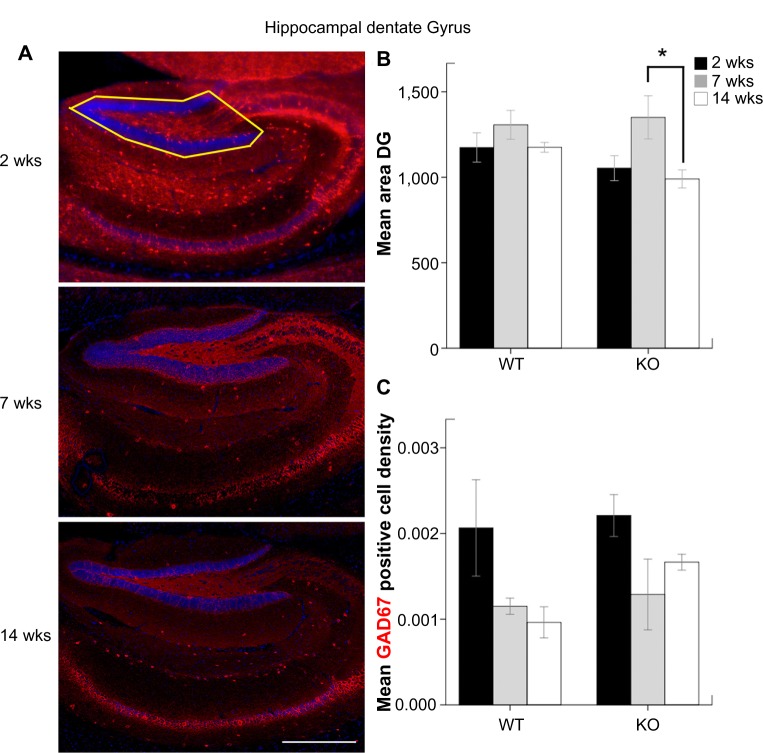
Figure 5.
(A) The outlined area denote the hippocampal DG upper blade that was used for the calculation of GAD67-positive cell densities (scale bar = 1000 μm). (B) Mean area of hippocampal DG inside the outlined region in Figure 5A. (C) Mean GAD67-positive cell densities in DG.

