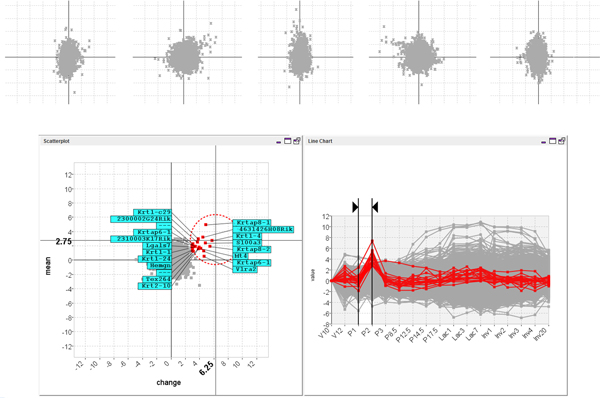
Figure 10.

Animating the MaTSE scatter-plot from interval P1 to P2 through to interval P2 to P3 reveals a group of outlying genes with rising then falling activity over a small interval of the time-course. A small group of outlying genes were seen to swing first out to the right of the scatter-plot, then out to the left (top). This indicates that the genes share an outlying pattern of rising then falling activity over the time-frame of the animation. The effect in the actual animated scatter-plot is a lot stronger due to the Gestalt law of common fate which groups together objects with a common trend of motion. The pattern can be highlighted in the line-chart view when the genes are selected in the scatter-plot using the excentric labelling tool (bottom).
