Figure 3.

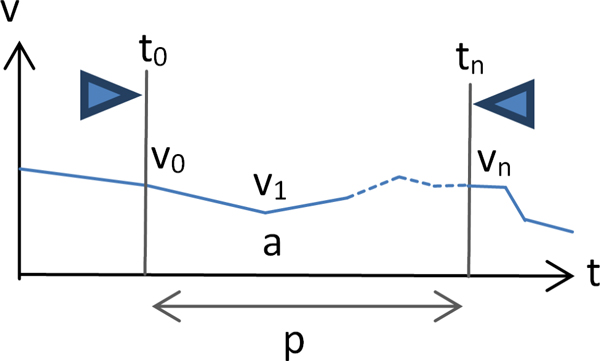
Attribute definitions for Time-series Explorer and MaTSE scatter-plot layouts. See table 1 for a comparison of the scatter-plot layouts in the Time-series Explorer and MaTSE.

Attribute definitions for Time-series Explorer and MaTSE scatter-plot layouts. See table 1 for a comparison of the scatter-plot layouts in the Time-series Explorer and MaTSE.